

Actual patterns

Patterns are graphical models which are formed in the chart by the price. According to one of the technical analysis postulates, history (price movement) repeats itself. It means that the price movements are often similar in the same situations which makes it possible to predict the further development of the situation with a high probability.
Relevant patterns by InstaTrade is an easy-to-use service which allows you to be aware of latest changes in the market and react to clues from the market in time. In our service you will always find the latest and most relevant patterns on any pair and any timeframe.
Double Top
was formed on 17.04 at 17:00:07 (UTC+0)
signal strength 3 of 5
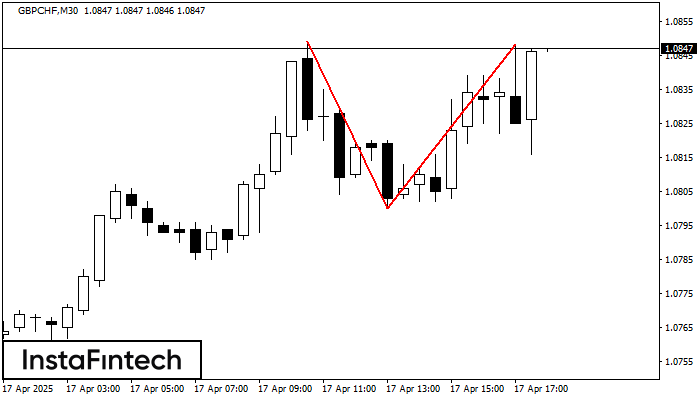
The Double Top pattern has been formed on GBPCHF M30. It signals that the trend has been changed from upwards to downwards. Probably, if the base of the pattern 1.0800 is broken, the downward movement will continue.
See Also
- All
- All
- Bearish Rectangle
- Bearish Symmetrical Triangle
- Bearish Symmetrical Triangle
- Bullish Rectangle
- Double Top
- Double Top
- Triple Bottom
- Triple Bottom
- Triple Top
- Triple Top
- All
- All
- Buy
- Sale
- All
- 1
- 2
- 3
- 4
- 5
Head and Shoulders
was formed on 06.06 at 14:30:02 (UTC+0)
signal strength 3 of 5
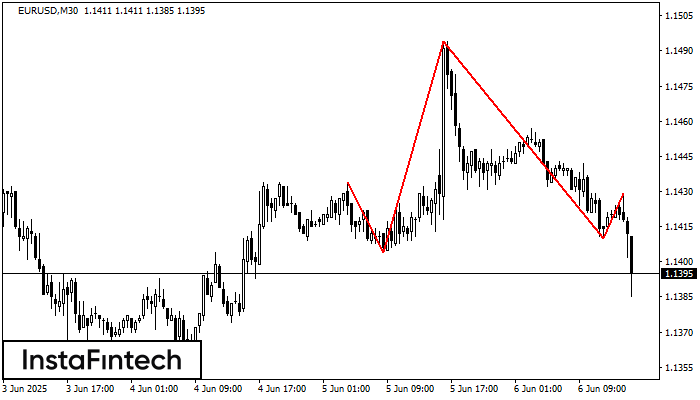
According to the chart of M30, EURUSD formed the Head and Shoulders pattern. The Head’s top is set at 1.1494 while the median line of the Neck is found
Open chart in a new window
Head and Shoulders
was formed on 03.06 at 10:30:19 (UTC+0)
signal strength 3 of 5
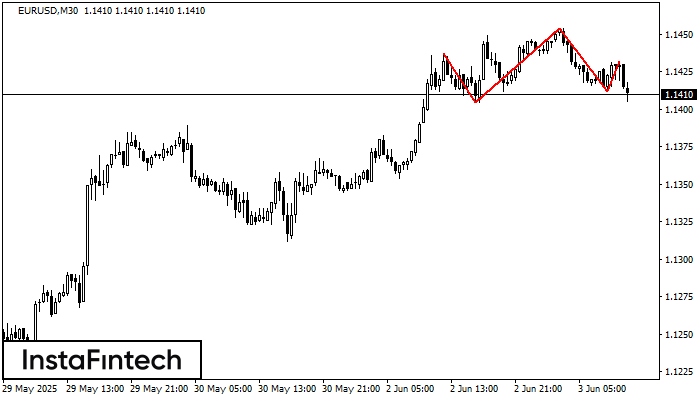
The technical pattern called Head and Shoulders has appeared on the chart of EURUSD M30. There are weighty reasons to suggest that the price will surpass the Neckline 1.1404/1.1412 after
Open chart in a new window
Inverse Head and Shoulder
was formed on 30.05 at 08:00:23 (UTC+0)
signal strength 3 of 5
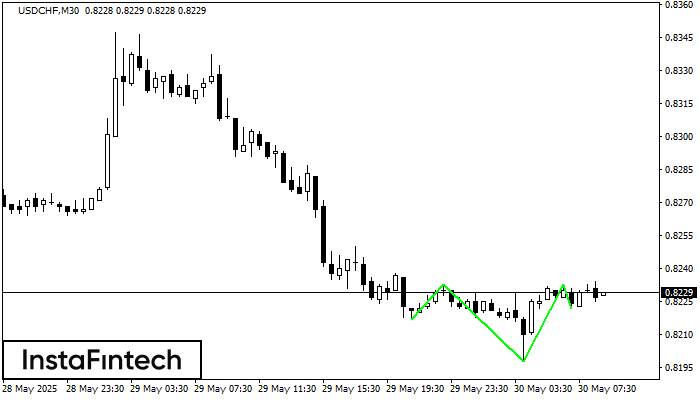
According to M30, USDCHF is shaping the technical pattern – the Inverse Head and Shoulder. In case the Neckline 0.8233/0.8233 is broken out, the instrument is likely to move toward
Open chart in a new window


