Voir aussi


 01.11.2023 06:45 AM
EUR/USD
Higher Timeframes
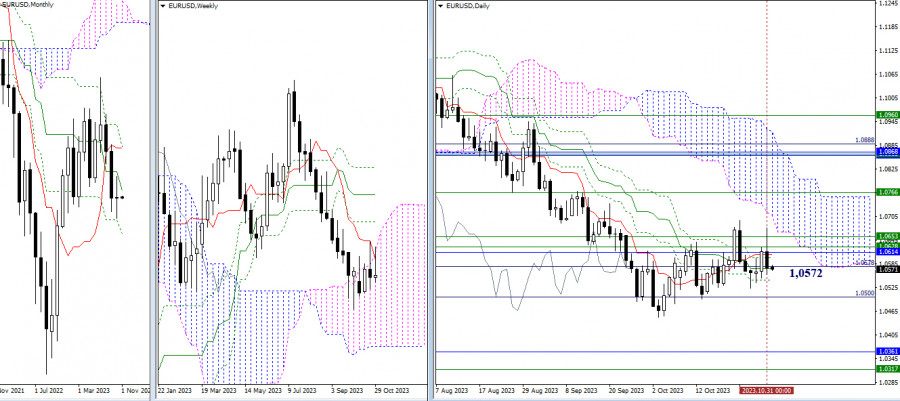
October closed with a candle of uncertainty. The market continues to operate within the range of daily levels, with the center of attraction being the medium-term trend (1.0572). At the start of the new trading month, minor adjustments to the Ichimoku indicator on the monthly timeframe led to the strengthening of the current weekly resistance zone (1.0628 - 1.0653) by the monthly medium-term trend (1.0614). As a result, the immediate objectives for bullish players, at the moment, are breaking through resistance levels (1.0614-28-53), updating the high (1.0695), and entering the daily cloud.
In the current situation, bearish players' prospects are focused on breaking through supports at 1.0500 - 1.0449 (the daily target level + the low) and declining towards the final level of the monthly Ichimoku cross (1.0360) and the lower boundary of the weekly cloud (1.0317).
H4 – H1
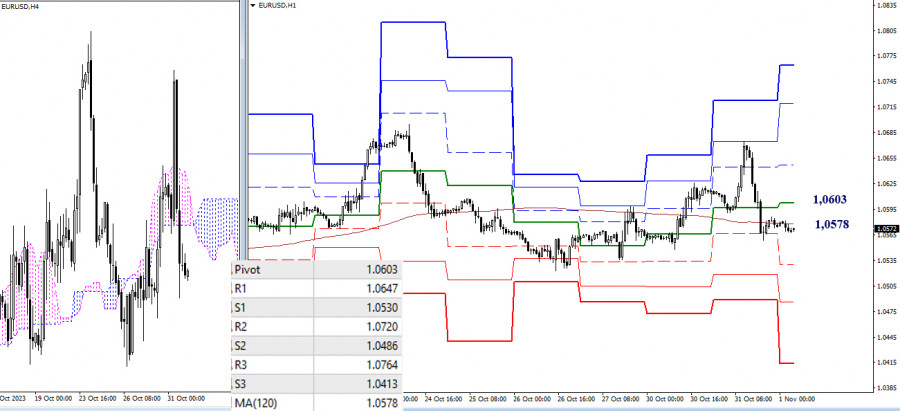
On the lower timeframes, there is also uncertainty in the past few hours. The market is hovering around the attraction zone of the weekly long-term trend (1.0578). The moving average is currently in a nearly horizontal position, confirming the balance of power. In the event of bearish activity and a strengthening of their sentiments, attention will be on passing through the supports of the classic pivot points (1.0530 - 1.0486 - 1.0413). If bulls restore their positions, their interests will shift towards breaking through the resistances of the classic pivot points (1.0603 - 1.0647 - 1.0720 - 1.0764).
***
GBP/USD
Higher Timeframes
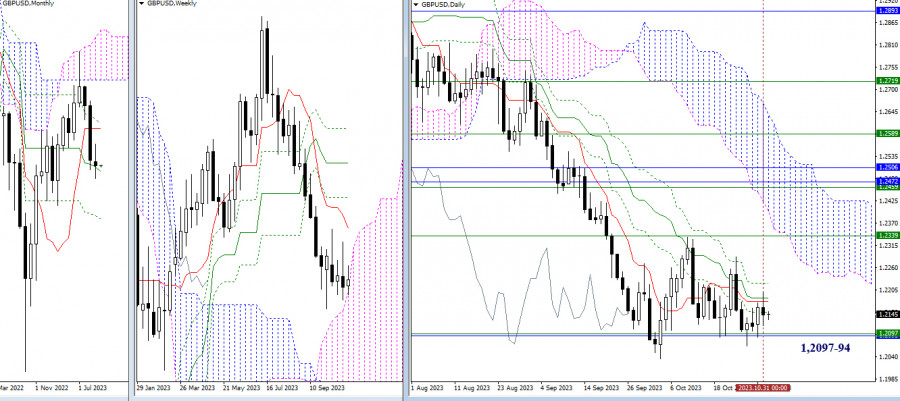
October did not provide clear support to any market players. The pair continues to consolidate around the upper boundary of the weekly cloud (1.2097). Most likely, the pound has decided to enter the weekly cloud in a sideways movement while utilizing the support of the monthly medium-term trend (1.2094). Only directed movement can change the situation. For bullish players, it is still important to overcome the attraction of the daily cross levels (1.2151 - 1.2178 - 1.2186 - 1.2221) and secure the support of the weekly short-term trend (1.2339). For bears, it is necessary to break free from the attraction of levels 1.2094 - 1.2097 and restore the downward trend (1.2036) to continue the decline.
H4 – H1
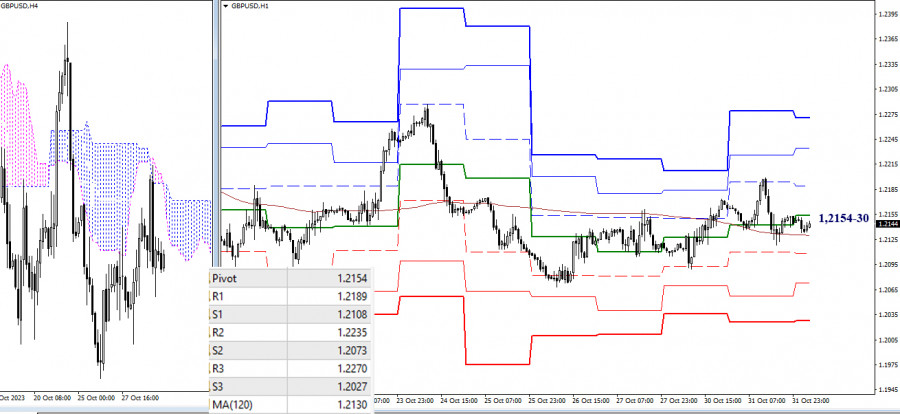
On the lower timeframes, the market is in a state of uncertainty and attraction to key levels, which are currently converging in the 1.2154-30 range (central pivot point + weekly long-term trend). Trading below these key levels will favor the development of bearish sentiments. Intraday bearish targets today are at 1.2108 - 1.2073 - 1.2027 (classic pivot points). Trading above these key levels will contribute to the strengthening of bullish positions. Intraday bullish targets can be noted at 1.2189 - 1.2235 - 1.2270 (resistances of the classic pivot points).
***
The technical analysis of the situation uses:
Higher timeframes - Ichimoku Kinko Hyo (9.26.52) + Fibo Kijun levels
Lower timeframes - H1 - Pivot Points (classic) + Moving Average 120 (weekly long-term trend)
You have already liked this post today
*The market analysis posted here is meant to increase your awareness, but not to give instructions to make a trade.
Il est probable que la paire EUR/USD continue de baisser dans les heures à venir et pourrait même atteindre le niveau 5/8 de Murray autour de 1,0986 la semaine prochaine
L'indicateur Eagle atteint des niveaux de survente, nous pensons donc que tout repli, tant que le prix de l'or reste au-dessus du niveau 4/8 Murray, sera considéré comme une opportunité
Liens utiles : Mes autres articles sont disponibles dans cette section Cours pour débutants d'InstaForex Analytique populaire Ouvrir un compte de trading Important : Les débutants en trading de forex
Graphiques Forex
Version Web

Your IP address shows that you are currently located in the USA. If you are a resident of the United States, you are prohibited from using the services of InstaFintech Group including online trading, online transfers, deposit/withdrawal of funds, etc.
If you think you are seeing this message by mistake and your location is not the US, kindly proceed to the website. Otherwise, you must leave the website in order to comply with government restrictions.
Why does your IP address show your location as the USA?
Please confirm whether you are a US resident or not by clicking the relevant button below. If you choose the wrong option, being a US resident, you will not be able to open an account with InstaTrade anyway.
We are sorry for any inconvenience caused by this message.


