Voir aussi


 31.01.2023 11:32 AM
EUR/USD
Higher time frames
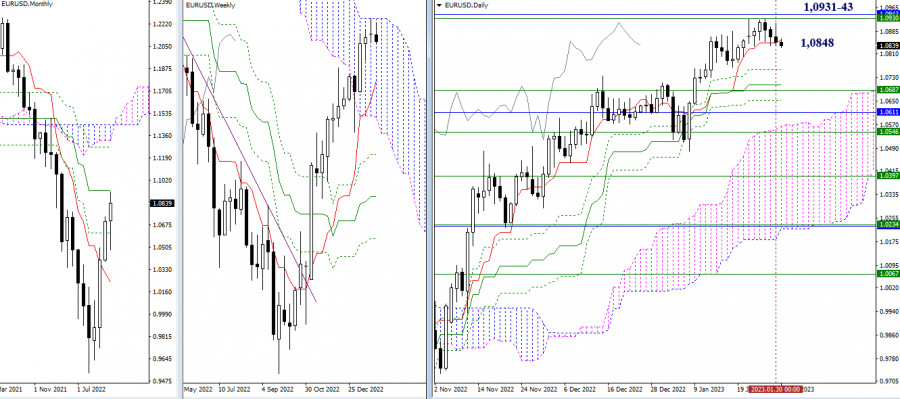
The situation has not changed much over the past 24 hours. The pair is still holding near the support level of the daily short-term trend (1.0848). Consolidation below this level and a further decline will bring the price to the lower levels of the daily Ichimoku Cross at 1.0759 – 1.0706 – 1.0653 and the weekly short-term trend at 1.0687. The bearish scenario is more likely in current conditions for various reasons. If bulls return to the market at some point, their main target will be the key resistance of 1.0931-43 (upper boundary of the weekly Ichimoku Cloud + monthly medium-term trend).
H4 – H1
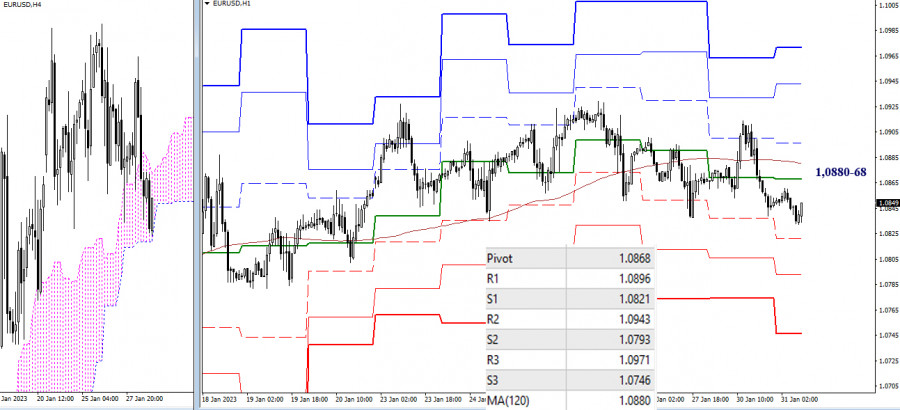
Bears are taking over the pair on lower time frames. The pair is currently trading below the central pivot level of 1.0868 and the weekly long-term trend of 1.0880. The next downward targets on the intraday chart are found at the support of standard pivot levels of 1.0821 – 1.0793 – 1.0746. A breakout of the Ichimoku Cloud on H4 and consolidation in the selling zone will support the bearish trend and will send the price for a new breakout.
***
GBP/USD
Higher time frames
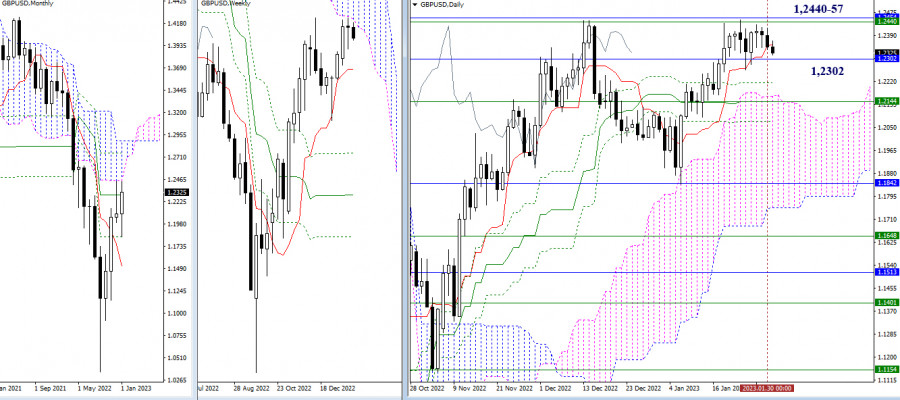
The daily short-term trend has slightly shifted from the level of 1.2302. The pair is still trading in the range between 1.2457-40 (upper boundaries of Ichimoku Clouds on monthly and weekly time frames) and 1.2302 (monthly medium-term trend). If the price leaves these boundaries, it may develop a new trajectory.
H4 – H1
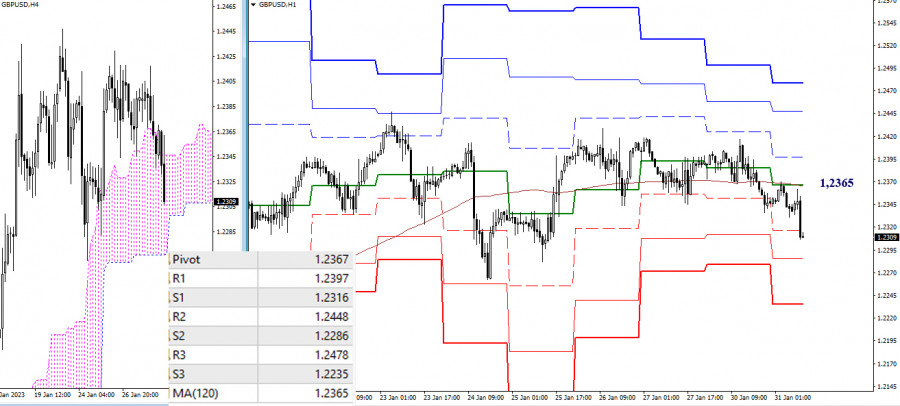
On lower time frames, the price has slipped below the key levels found at 1.2367-65 (central pivot level + weekly long-term trend). Trading below this range will support the sellers. Other intraday targets for bears are located at standard pivot levels of 1.2286 and 1.2235 as well as at the lower boundary of the cloud on H4. If the price settles outside the H4 cloud, it may head lower for new downward targets.
***
Technical analysis is based on:
Higher time frames – Ichimoku Kinko Hyo (9.26.52) + Fibo Kijun levels
Lower time frames – H1: Pivot Points (standard) + 120-day Moving Average (weekly long-term trend)
You have already liked this post today
*The market analysis posted here is meant to increase your awareness, but not to give instructions to make a trade.
Sur le graphique de 4 heures, l'instrument de la matière première argent est visible même si sa condition se renforce, ce qui est confirmé par le mouvement du prix
Bien que sur le graphique de 4 heures, l'indice Nasdaq 100 soit en phase latérale, la fourchette est assez large pour offrir une opportunité assez prometteuse. Actuellement, l'indicateur Stochastic Oscillator
Avec l'apparition d'une divergence entre le mouvement des prix de la paire de devises croisées AUD/JPY et l'indicateur Stochastic Oscillator, ainsi que le mouvement des prix de l'AUD/JPY
Si nous examinons le graphique de 4 heures, l'instrument de la commodité Or semble toujours évoluer dans un biais haussier, mais l'apparition d'une divergence entre le mouvement du prix
Liens utiles : Mes autres articles sont disponibles dans cette section Cours InstaForex pour débutants Analyses Populaires Ouvrir un compte de trading Important : Les débutants en trading forex doivent
Si nous examinons le graphique de 4 heures de la paire de devises croisées GBP/CHF, plusieurs faits intéressants se dégagent. Tout d'abord, l'apparition d'un modèle de Triangle suivi du mouvement
Avec le mouvement des prix de la paire de devises croisée AUD/CAD passant au-dessus de la WMA (21), qui présente une inclinaison à la hausse, et l'apparition d'une convergence entre
L'indicateur eagle a atteint des niveaux de surachat. Cependant, le métal pourrait encore atteindre le sommet autour de 8/8 Murray, ce qui représente une barrière solide pour l'or. Sous cette
D'après ce qui est observé sur le graphique de 4 heures, la paire de devises croisée EUR/GBP semble se déplacer au-dessus de l'EMA (100), ce qui indique que les acheteurs
Your IP address shows that you are currently located in the USA. If you are a resident of the United States, you are prohibited from using the services of InstaFintech Group including online trading, online transfers, deposit/withdrawal of funds, etc.
If you think you are seeing this message by mistake and your location is not the US, kindly proceed to the website. Otherwise, you must leave the website in order to comply with government restrictions.
Why does your IP address show your location as the USA?
Please confirm whether you are a US resident or not by clicking the relevant button below. If you choose the wrong option, being a US resident, you will not be able to open an account with InstaTrade anyway.
We are sorry for any inconvenience caused by this message.


