Voir aussi


 13.04.2023 11:06 PM
Overview:
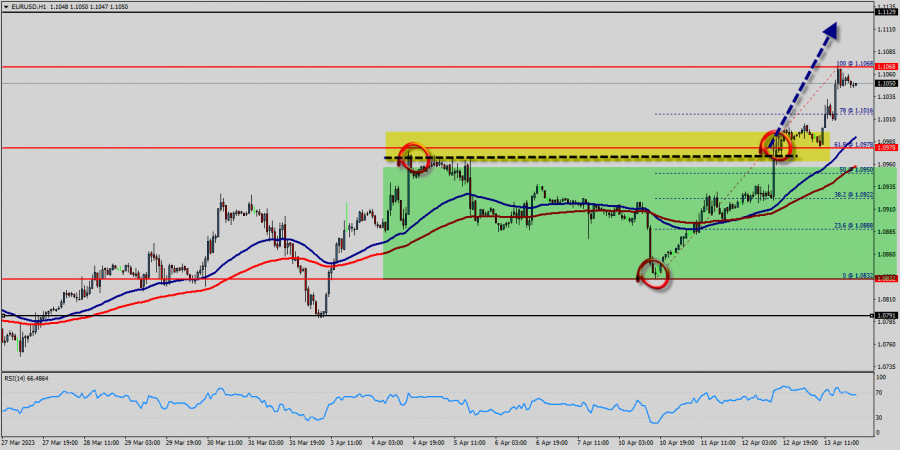
The EUR/USD pair will continue to rise from the level of 1.0978. The support is found at the level of 1.0978, which represents the 61.8% Fibonacci retracement level in the H1 time frame.
The price is likely to form a double bottom. Today, the major support is seen at 1.0832, while immediate resistance is seen at 1.1068. Accordingly, the EUR/USD pair is showing signs of strength following a breakout of a high at 1.1068.
Moreover, the RSI starts signaling an upward trend, and the trend is still showing strength above the moving average (100). Hence, the market is indicating a bullish opportunity above the area of 1.0978. So, the market is likely to show signs of a bullish trend around 1.0978 - 1.1000. In other words, buy orders are recommended above the ratio of 61.8% Fibonacci (1.0978).
So, buy above the level of 1.1068 with the first target at 1.1129 in order to test the daily resistance 1 and move further to 1.1150.
Also, the level of 1.1150 is a good place to take profit because it will form a new double top.
Amid the previous events, the pair is still in an uptrend; for that we expect the EUR/USD pair to climb from 1.0979 to 1.1129 today.
At the same time, in case a reversal takes place and the EUR/USD pair breaks through the support level of 1.0979, a further decline to 1.0832 can occur, which would indicate a bearish market.
You have already liked this post today
*The market analysis posted here is meant to increase your awareness, but not to give instructions to make a trade.
Notre plan de trading pour les prochaines heures est de vendre l'euro en dessous du sommet du canal de tendance baissière, avec des objectifs à 1.1189, et de combler
Liens utiles : Mes autres articles sont disponibles dans cette section Cours pour débutants d'InstaForex Analytique Populaire Ouvrir un compte de trading Important : Les débutants en trading forex doivent
Your IP address shows that you are currently located in the USA. If you are a resident of the United States, you are prohibited from using the services of InstaFintech Group including online trading, online transfers, deposit/withdrawal of funds, etc.
If you think you are seeing this message by mistake and your location is not the US, kindly proceed to the website. Otherwise, you must leave the website in order to comply with government restrictions.
Why does your IP address show your location as the USA?
Please confirm whether you are a US resident or not by clicking the relevant button below. If you choose the wrong option, being a US resident, you will not be able to open an account with InstaTrade anyway.
We are sorry for any inconvenience caused by this message.

