Voir aussi


 13.10.2021 03:00 PM
Bitcoin
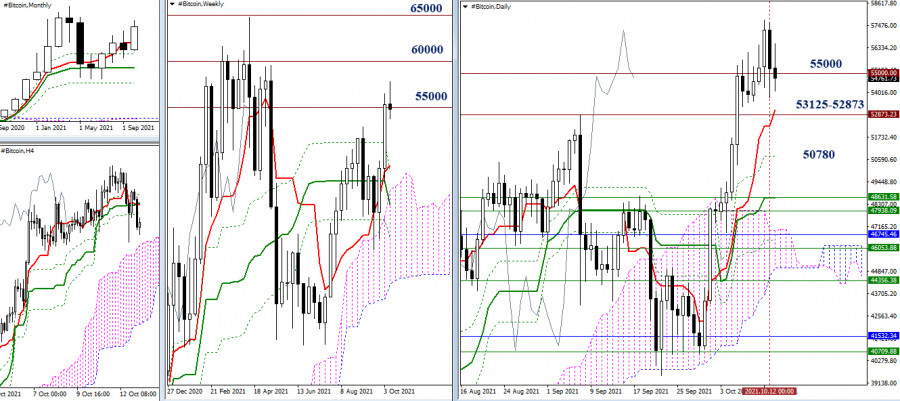
During the previous week, there has been a slowdown while testing the important level of 55,000. So, with the beginning of the new week, the bulls tried to break through the attraction of the level and continue the rise. The next pivot point could be the resistance level of 60,000. However, the bullish mood immediately changed into a bearish correction, as a result, Bitcoin returned to the previous consolidation zone in the attraction and influence area of the 55,000 level. In case of strengthening of corrective opportunities, we can expect a decline to the support levels of 53125 - 52873 (daily short-term trend + historical level). The next strong support zone is in the area of 47938 - 48631 (weekly levels + daily Kijun). The level of 50780 (daily Fibo Kijun) can provide intermediate support on this path.
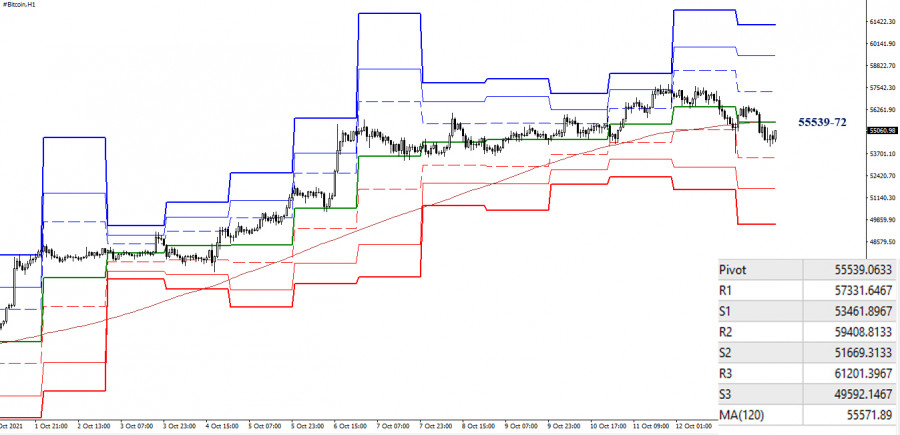
The correction in the higher time frames led to the breakdown of the key levels in the smaller time frames, which are joining forces at 55579-32 (central pivot level + weekly long-term trend) today. The resumption of the decline will lead Bitcoin to support the classic pivot levels 53462 - 51669 - 49592. On the contrary, the return of the bulls to the key levels (55579-32) can return bullish sentiment and advantages. In this case, the intraday pivot points will be the resistances of the classic pivot levels (57332 - 59409 - 61202).
***
Ichimoku Kinko Hyo (9.26.52) and Kijun-sen levels in the higher time frames, as well as classic Pivot Points and Moving Average (120) on the H1 chart, are used in the technical analysis of this cryptocurrency.
You have already liked this post today
*The market analysis posted here is meant to increase your awareness, but not to give instructions to make a trade.
Le Bitcoin se rapproche progressivement de son record historique et, selon plusieurs analystes, il est sur le point d'établir un nouveau sommet. Les niveaux actuels, avoisinant les 105,000 $, représentent
Si nous examinons le graphique de 4 heures, la cryptomonnaie Ethereum semble évoluer au-dessus de la WMA (21) qui sert de support dynamique, où la WMA a une pente ascendante
Sur le graphique de 4 heures, la cryptomonnaie Uniswap semble présenter un modèle de Coin élargi descendant. Ainsi, même si le mouvement du prix d'Uniswap se situe en dessous
Le Bitcoin a dépassé les 100,000 dollars, tandis que l'Ethereum tente de se consolider au-dessus de 2,000 dollars. Après le rallye spectaculaire d'hier, qui s'est poursuivi durant la séance asiatique
Si nous observons le graphique de 4 heures de la cryptomonnaie Ethereum, il semble que le mouvement des prix évolue au-dessus de la WMA (30 Shift 2) qui présente également
Sur le graphique en 4 heures de la cryptomonnaie Bitcoin, l'indicateur Stochastic Oscillator est actuellement en conditions de surachat et se prépare à croiser pour une vente et à passer
Alors que les indices boursiers restent stables, l'or se consolide près de ses sommets, et le Bitcoin attire à nouveau l'attention. Le fleuron du marché des cryptomonnaies s'est approché
Le Bitcoin a atteint juste en dessous de 100,000 dollars, tandis que l'Ethereum a atteint 1,900 dollars. Une telle croissance majeure du marché des cryptomonnaies confirme à nouveau ses perspectives
Graphiques Forex
Version Web

Your IP address shows that you are currently located in the USA. If you are a resident of the United States, you are prohibited from using the services of InstaFintech Group including online trading, online transfers, deposit/withdrawal of funds, etc.
If you think you are seeing this message by mistake and your location is not the US, kindly proceed to the website. Otherwise, you must leave the website in order to comply with government restrictions.
Why does your IP address show your location as the USA?
Please confirm whether you are a US resident or not by clicking the relevant button below. If you choose the wrong option, being a US resident, you will not be able to open an account with InstaTrade anyway.
We are sorry for any inconvenience caused by this message.


