Voir aussi


 28.07.2022 01:02 PM
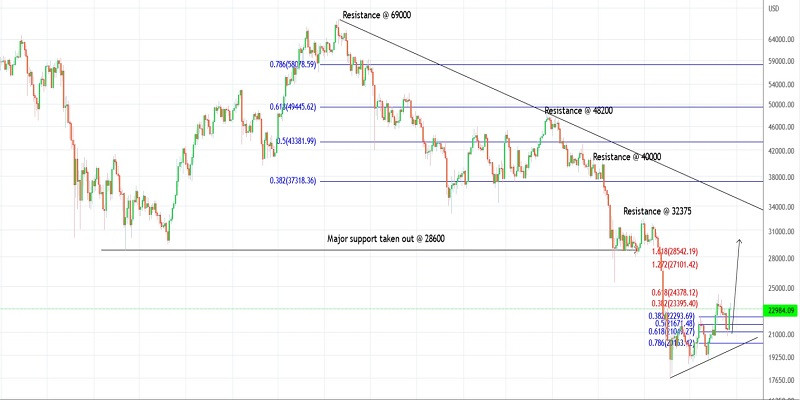
Bitcoin rallied through $23,400-500 post FOMC on Wednesday. The crypto registered an intraday high at around $23,450 on Thursday, falling in line with our earlier projections. Intraday pullbacks are possible but prices should remain well capped above the $20,700 interim lows as bulls are poised to push towards the $29,000-400 zone in the next few weeks.
Bitcoin has been developing a larger-degree counter-trend rally since June 18, 2022, after printing lows at around $17,500. Earlier, it had dropped from the $69,000 all-time high to $17,500 in the fall consisting of three waves. The corrective wave is probably into its last leg, which should push the price to $29,400 as projected on the daily chart here.
Also, note that immediate price resistance is seen at around $32,200, which remains close to the proposed rally. If the price touches the downtrend line, it could reach up to the $34,000-35,000 zone before hitting resistance, both the trendline and the Fibonacci levels are seen on the chart here. Bitcoin is expected to produce a bearish bounce thereafter and decline below $17,500.
Bitcoin carved a recent lower-degree upswing between $18,900 and $24,300 as seen on the chart here. Further, it retraced towards the Fibonacci 0.618 level at around $20,700, producing a strong bullish reversal (a Morning Star candlestick pattern). A high probability remains for prices to stay above $18,700 and push through $29,400 in the next few weeks.
Potential rally towards $29,400 against $20,500
Good luck!
You have already liked this post today
*The market analysis posted here is meant to increase your awareness, but not to give instructions to make a trade.
Le Bitcoin se rapproche progressivement de son record historique et, selon plusieurs analystes, il est sur le point d'établir un nouveau sommet. Les niveaux actuels, avoisinant les 105,000 $, représentent
Si nous examinons le graphique de 4 heures, la cryptomonnaie Ethereum semble évoluer au-dessus de la WMA (21) qui sert de support dynamique, où la WMA a une pente ascendante
Sur le graphique de 4 heures, la cryptomonnaie Uniswap semble présenter un modèle de Coin élargi descendant. Ainsi, même si le mouvement du prix d'Uniswap se situe en dessous
Le Bitcoin a dépassé les 100,000 dollars, tandis que l'Ethereum tente de se consolider au-dessus de 2,000 dollars. Après le rallye spectaculaire d'hier, qui s'est poursuivi durant la séance asiatique
Si nous observons le graphique de 4 heures de la cryptomonnaie Ethereum, il semble que le mouvement des prix évolue au-dessus de la WMA (30 Shift 2) qui présente également
Sur le graphique en 4 heures de la cryptomonnaie Bitcoin, l'indicateur Stochastic Oscillator est actuellement en conditions de surachat et se prépare à croiser pour une vente et à passer
Alors que les indices boursiers restent stables, l'or se consolide près de ses sommets, et le Bitcoin attire à nouveau l'attention. Le fleuron du marché des cryptomonnaies s'est approché
Le Bitcoin a atteint juste en dessous de 100,000 dollars, tandis que l'Ethereum a atteint 1,900 dollars. Une telle croissance majeure du marché des cryptomonnaies confirme à nouveau ses perspectives
Your IP address shows that you are currently located in the USA. If you are a resident of the United States, you are prohibited from using the services of InstaFintech Group including online trading, online transfers, deposit/withdrawal of funds, etc.
If you think you are seeing this message by mistake and your location is not the US, kindly proceed to the website. Otherwise, you must leave the website in order to comply with government restrictions.
Why does your IP address show your location as the USA?
Please confirm whether you are a US resident or not by clicking the relevant button below. If you choose the wrong option, being a US resident, you will not be able to open an account with InstaTrade anyway.
We are sorry for any inconvenience caused by this message.

