See also


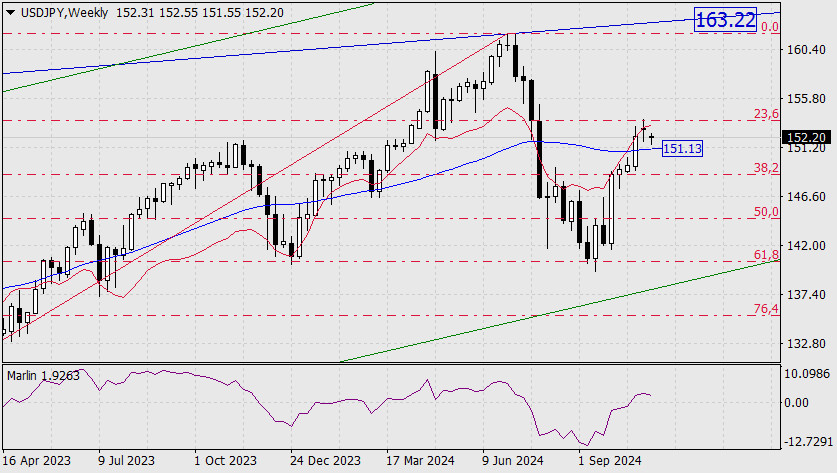
On the weekly chart, the price has consolidated above the MACD line (151.13), maintaining the primary uptrend.
However, the price has precisely tested the 23.6% corrective level of a longer movement, and the Marlin oscillator is turning downward, indicating a chance for the price to fall below 151.13. This scenario leaves little confidence in the price consolidating above last week's high (153.89).
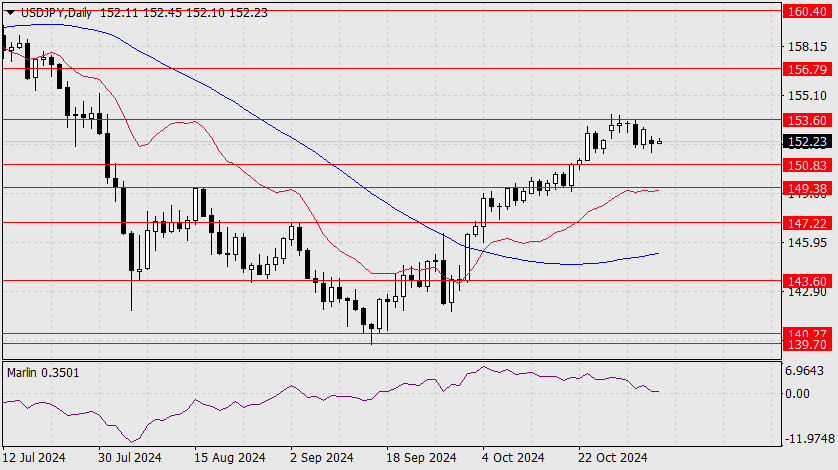
The daily chart also doesn't clarify the price's intention, as it fluctuates within the established range of 150.83–153.60. Marlin could either turn back from the boundary of the descending territory or reverse and rise.
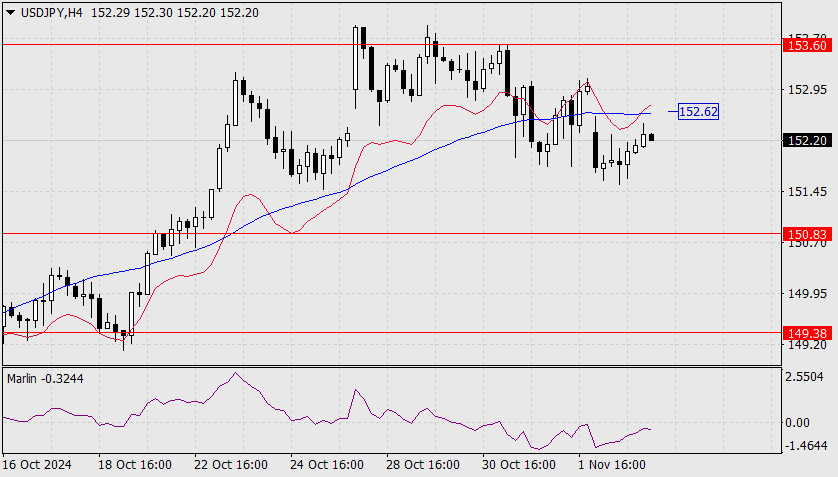
On the four-hour chart, the price is awaiting support from Marlin (its shift to the positive territory) to approach the MACD line near the 152.62 mark confidently. Success in this move would enable a test of the target level at 153.60 and close the gap.
You have already liked this post today
*The market analysis posted here is meant to increase your awareness, but not to give instructions to make a trade.


