See also


 13.11.2023 10:07 AM
Crypto Industry News:
Bitcoin price is rising. It increased by over 5% on a weekly basis. One classic on-chain indicator suggests that the cryptocurrency's peak this cycle could be at least $110,000.
It's about the so-called Terminal Price. This is a key metric that is calculated by dividing Coin Days Destroyed (CDD) by the existing supply. CDD measures the number of days BTC has been dormant each time a certain amount of coins moves on the chain, serving as an indicator of hodler intent and activity. Created by Philip Swift, Principal Analyst at Glassnode, Terminal Price helps you determine ATH for a given cycle.
During the bull market in 2017 and in April 2021, the bitcoin price hit the Terminal Price trend line. Swift suggests that selling "close to" the final price may be a wise strategy.
According to the model, during the current cycle ATH may amount to USD 110,000, and the bull market is expected to end at the end of 2025. At the same time, however, it is worth adding that due to the fact that the Terminal Price increases over time, USD 110,000 for 1 BTC may show careful respect.
Technical Market Outlook:
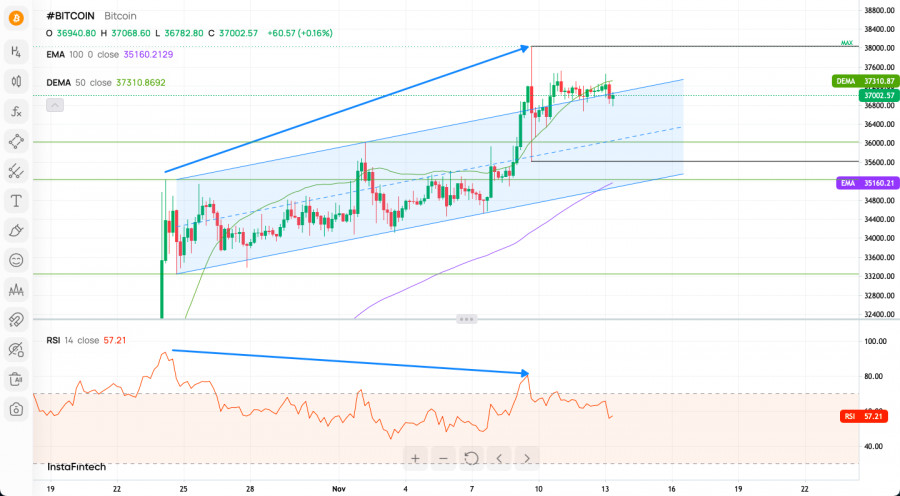
The BTC/USD pair has made a new swing high at the level of $38,027 as the bulls are in control of the market. The price is again coming off the extremely overbought conditions on the H4 time frame chart and now there is a clear Bearish Divergence between the price and the momentum on the H4 time-frame chart, so a pull-back is due soon. The intraday technical support is seen at $36,702, $36,400 and $36,782. The next target for bulls is seen at the level of $40,000, but first the last week high located at $37,889 must be violated. The momentum remains strong and positive, so after the pull-back for the last swing high is done, the up trend shall continue.
Weekly Pivot Points:
WR3 - $38,322
WR2 - $37,676
WR1 - $37,333
Weekly Pivot - $37,030
WS1 - $36,687
WS2 - $36,384
WS3 - $35,738
Trading Outlook:
The bulls broken above the gamechanging level located at $25,442, so now the mid-term outlook for BTC is bullish. The next target for bulls is seen at the level of $40,000. As long as the level of 19,572 is not clearly violated, there is a chance for a long-term up trend to continue.
You have already liked this post today
*The market analysis posted here is meant to increase your awareness, but not to give instructions to make a trade.
Bitcoin and Ethereum buyers have achieved new key resistance levels, indicating strong demand. Bitcoin has reached the $97,400 level, while Ethereum has approached the $1,870 mark. Meanwhile, the buzz around
With the appearance of the Bullish 123 pattern followed by the appearance of the Bullish Ross Hook which managed to break the previous downtrend line and the Stochastic Oscillator indicator
Amid a steady outflow of coins from exchanges, renewed futures market activity, and a rise in short-term holders, the world's largest cryptocurrency lays the groundwork for a potential move that
While financial mainstream market participants are mulling over recession risks and interest rates, Bitcoin is steadily gaining ground. April has turned out to be the strongest month for the leading
Graphical patterns
indicator.
Notices things
you never will!
InstaTrade
video analytics

Your IP address shows that you are currently located in the USA. If you are a resident of the United States, you are prohibited from using the services of InstaFintech Group including online trading, online transfers, deposit/withdrawal of funds, etc.
If you think you are seeing this message by mistake and your location is not the US, kindly proceed to the website. Otherwise, you must leave the website in order to comply with government restrictions.
Why does your IP address show your location as the USA?
Please confirm whether you are a US resident or not by clicking the relevant button below. If you choose the wrong option, being a US resident, you will not be able to open an account with InstaTrade anyway.
We are sorry for any inconvenience caused by this message.

