See also


 22.06.2023 01:58 PM
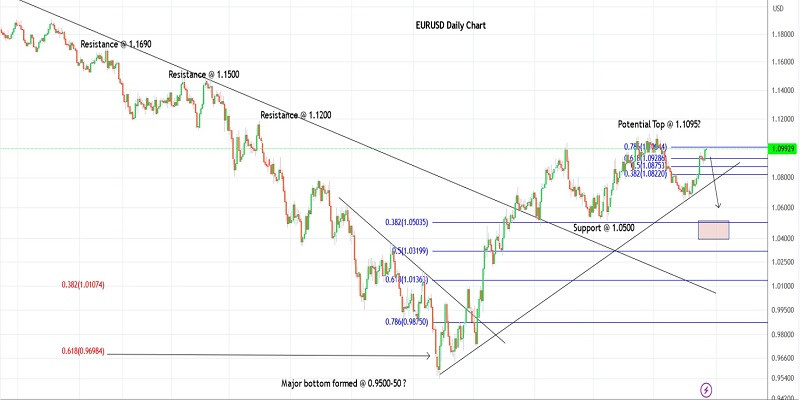
EURUSD yet again managed to rally and print an intraday high around 1.1010 on Thursday. The single currency pair is seen to be trading close to 1.0990 at this point in writing as the bears prepare to come back in control soon. The last wave higher has been accompanied by bearish divergence on lower-degree timeframes. Hence, the potential for a bearish reversal is high.
EURUSD is still carving a larger-degree corrective wave since February 2023 after hitting the 1.1035 high. It is either unfolding as a triangle or an expanded flat structure, which could drag prices lower towards 1.0700-50 at least and down to 1.0500 going forward. Once the corrective phase is complete, the bulls will be back in control and push the pair through 1.1200.
EURUSD has now managed to reach the Fibonacci 0.786 retracement of its recent downswing close to 1.1010 and is now easing off. A break below 1.0980 will be the first sign to confirm that a potential top is in place and the bears are back in control. If the above structure unfolds likewise, the currency pair will witness a roughly 400-pips drop in the next few weeks.
A potential bearish wave towards 1.0700 to resume soon.
Good luck!
You have already liked this post today
*The market analysis posted here is meant to increase your awareness, but not to give instructions to make a trade.
The GBP/USD pair also showed a downward movement on Wednesday, for which there were no valid reasons. There were no noteworthy events in the UK yesterday, while the U.S. released
Wednesday's Trade Analysis: 1H chart of the EUR/USD pair. The EUR/USD currency pair continued its downward movement within the sideways channel on the hourly time frame on Wednesday —
Analysis of Tuesday's Trades 1H Chart of GBP/USD On Tuesday, the GBP/USD pair corrected downward after another surge on Monday. No fundamental or macroeconomic reasons supported such movements on either
Analysis of Tuesday's Trades 1H Chart of EUR/USD On Tuesday, the EUR/USD currency pair continued to trade within a sideways channel, which is now visible on virtually any timeframe
On Tuesday, the GBP/USD currency pair failed to continue the upward movement it had started so vigorously on Monday. It is worth recalling that there were no solid reasons
The EUR/USD currency pair continued to trade within a sideways channel throughout Tuesday. The flat movement is visible in the chart above. Last week, the pair briefly broke
Your IP address shows that you are currently located in the USA. If you are a resident of the United States, you are prohibited from using the services of InstaFintech Group including online trading, online transfers, deposit/withdrawal of funds, etc.
If you think you are seeing this message by mistake and your location is not the US, kindly proceed to the website. Otherwise, you must leave the website in order to comply with government restrictions.
Why does your IP address show your location as the USA?
Please confirm whether you are a US resident or not by clicking the relevant button below. If you choose the wrong option, being a US resident, you will not be able to open an account with InstaTrade anyway.
We are sorry for any inconvenience caused by this message.

