

Actual patterns

Patterns are graphical models which are formed in the chart by the price. According to one of the technical analysis postulates, history (price movement) repeats itself. It means that the price movements are often similar in the same situations which makes it possible to predict the further development of the situation with a high probability.
Relevant patterns by InstaTrade is an easy-to-use service which allows you to be aware of latest changes in the market and react to clues from the market in time. In our service you will always find the latest and most relevant patterns on any pair and any timeframe.
Bearish pennant
was formed on 07.04 at 01:00:16 (UTC+0)
signal strength 3 of 5

The Bearish pennant pattern has formed on the NZDUSD M30 chart. It signals potential continuation of the existing trend. Specifications: the pattern’s bottom has the coordinate of 0.5563; the projection of the flagpole height is equal to 29 pips. In case the price breaks out the pattern’s bottom of 0.5563, the downtrend is expected to continue for further level 0.5533.
- All
- All
- Bearish Rectangle
- Bearish Symmetrical Triangle
- Bearish Symmetrical Triangle
- Bullish Rectangle
- Double Top
- Double Top
- Triple Bottom
- Triple Bottom
- Triple Top
- Triple Top
- All
- All
- Buy
- Sale
- All
- 1
- 2
- 3
- 4
- 5
Double Top
was formed on 04.06 at 09:00:37 (UTC+0)
signal strength 4 of 5
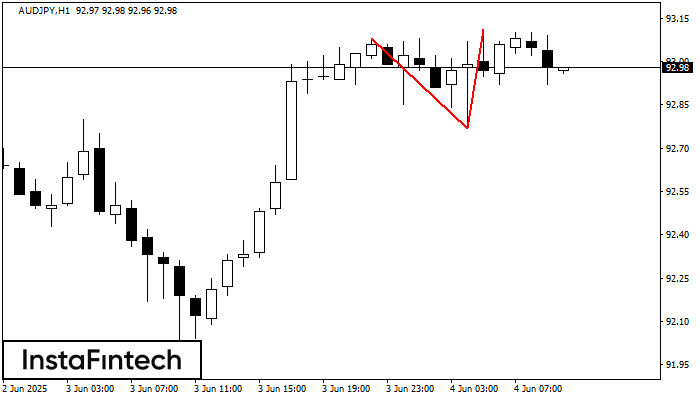
The Double Top reversal pattern has been formed on AUDJPY H1. Characteristics: the upper boundary 93.08; the lower boundary 92.77; the width of the pattern is 34 points. Sell trades
Open chart in a new window
Double Bottom
was formed on 04.06 at 09:00:01 (UTC+0)
signal strength 4 of 5
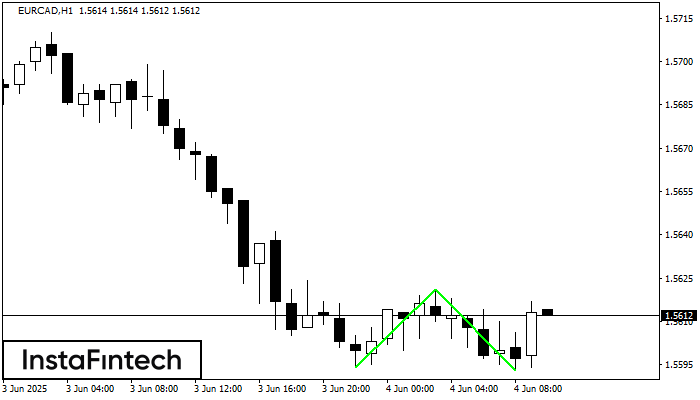
The Double Bottom pattern has been formed on EURCAD H1. This formation signals a reversal of the trend from downwards to upwards. The signal is that a buy trade should
Open chart in a new window
Double Top
was formed on 04.06 at 08:59:48 (UTC+0)
signal strength 4 of 5
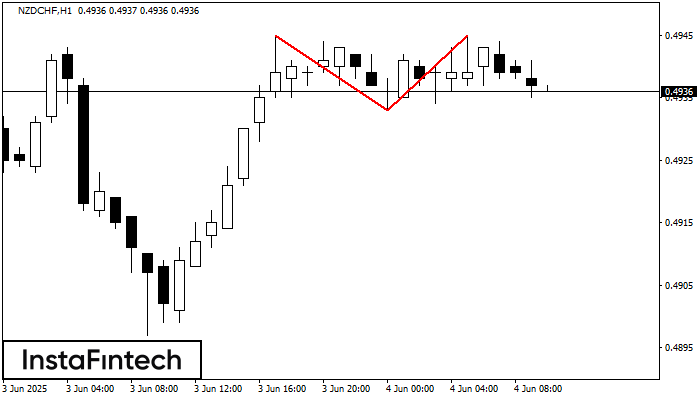
The Double Top reversal pattern has been formed on NZDCHF H1. Characteristics: the upper boundary 0.4945; the lower boundary 0.4933; the width of the pattern is 12 points. Sell trades
Open chart in a new window


