

Actual patterns

Patterns are graphical models which are formed in the chart by the price. According to one of the technical analysis postulates, history (price movement) repeats itself. It means that the price movements are often similar in the same situations which makes it possible to predict the further development of the situation with a high probability.
Relevant patterns by InstaTrade is an easy-to-use service which allows you to be aware of latest changes in the market and react to clues from the market in time. In our service you will always find the latest and most relevant patterns on any pair and any timeframe.
Double Top
was formed on 11.04 at 20:05:18 (UTC+0)
signal strength 1 of 5
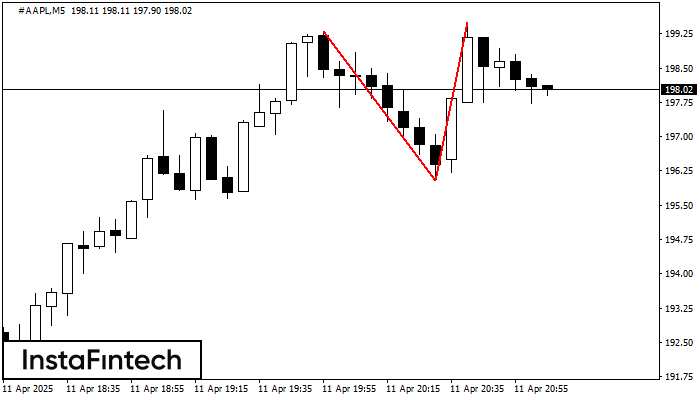
On the chart of #AAPL M5 the Double Top reversal pattern has been formed. Characteristics: the upper boundary 199.49; the lower boundary 196.03; the width of the pattern 346 points. The signal: a break of the lower boundary will cause continuation of the downward trend targeting the 195.88 level.
The M5 and M15 time frames may have more false entry points.
See Also
- All
- All
- Bearish Rectangle
- Bearish Symmetrical Triangle
- Bearish Symmetrical Triangle
- Bullish Rectangle
- Double Top
- Double Top
- Triple Bottom
- Triple Bottom
- Triple Top
- Triple Top
- All
- All
- Buy
- Sale
- All
- 1
- 2
- 3
- 4
- 5
Bearish pennant
was formed on 02.06 at 09:40:38 (UTC+0)
signal strength 1 of 5
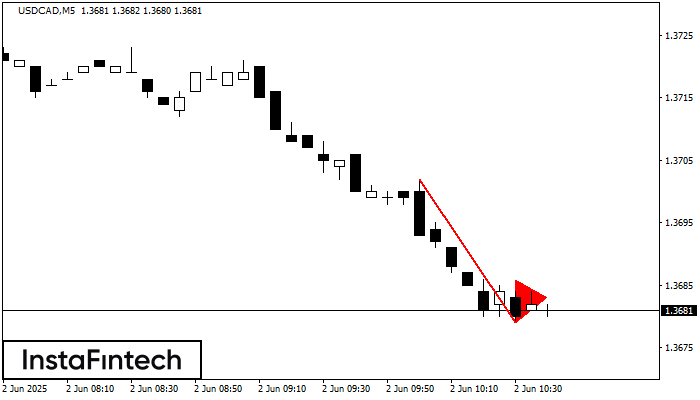
The Bearish pennant pattern has formed on the USDCAD M5 chart. It signals potential continuation of the existing trend. Specifications: the pattern’s bottom has the coordinate of 1.3679; the projection
The M5 and M15 time frames may have more false entry points.
Open chart in a new window
Bullish Symmetrical Triangle
was formed on 02.06 at 09:22:12 (UTC+0)
signal strength 4 of 5

According to the chart of H1, EURJPY formed the Bullish Symmetrical Triangle pattern. The lower border of the pattern touches the coordinates 162.28/163.37 whereas the upper border goes across 164.23/163.37
Open chart in a new window
Double Bottom
was formed on 02.06 at 09:00:13 (UTC+0)
signal strength 3 of 5

The Double Bottom pattern has been formed on GBPJPY M30. Characteristics: the support level 193.37; the resistance level 194.63; the width of the pattern 126 points. If the resistance level
Open chart in a new window


