

অ্যাকচুয়াল প্যাটার্নস

প্যাটার্ন হলো গ্রাফিক্যাল মডেল, যা মূল্য ওঠানামার ভিত্তিতে চার্টে তৈরি হয়। টেকনিক্যাল বিশ্লেষণের নীতি অনুযায়ী, ইতিহাসের (প্রাইস মুভমেন্ট) পুনরাবৃত্তি ঘটে। অর্থাৎ, পরিস্থিতি যদি একই রকম থাকে তাহলে প্রাইস মুভমেন্টও প্রায় একই রকম হয়। এর ফলে মূল্যের ওঠানামা কেমন হবে তা আগেই থেকেই অনুমান করা যায়।
ইন্সটাফরেক্স এর প্রাসঙ্গিক প্যাটার্নসমূহ সহজেই ব্যবহার করা যায়, যার মাধ্যমে মার্কেটের সর্বশেষ পরিস্থিতি জানা যায় এবং তার উপর ভিত্তি করে সিদ্ধান্ত নেওয়া যায়। আমাদের সেবাগুলো থেকে আপনি যেকোনো পেয়ার এবং টাইমফ্রেমের জন্য সর্বশেষ এবং সবচেয়ে প্রাসঙ্গিক প্যাটার্নগুলো খুঁজে পাবেন।
Bearish Rectangle
was formed on 11.04 at 22:10:27 (UTC+0)
signal strength 1 of 5

According to the chart of M5, USDCAD formed the Bearish Rectangle which is a pattern of a trend continuation. The pattern is contained within the following borders: lower border 1.3871 – 1.3871 and upper border 1.3891 – 1.3891. In case the lower border is broken, the instrument is likely to follow the downward trend.
The M5 and M15 time frames may have more false entry points.
আরও দেখুন
- All
- All
- Bearish Rectangle
- Bearish Symmetrical Triangle
- Bearish Symmetrical Triangle
- Bullish Rectangle
- Double Top
- Double Top
- Triple Bottom
- Triple Bottom
- Triple Top
- Triple Top
- All
- All
- Buy
- Sale
- All
- 1
- 2
- 3
- 4
- 5
বুলিশ ফ্ল্যাগ
was formed on 04.06 at 12:17:33 (UTC+0)
signal strength 2 of 5
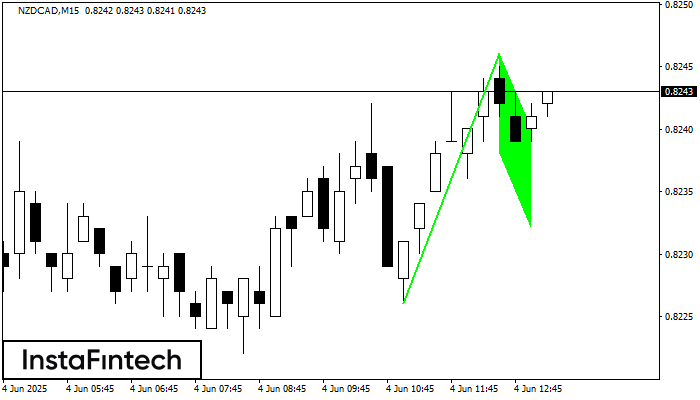
M15 চার্টে NZDCAD-এর বুলিশ ফ্ল্যাগ প্যাটার্ন গঠিত হয়েছে। প্যাটার্নের নীচের সীমানা 0.8238/0.8232 -এ অবস্থিত, এবং উপরের সীমানা 0.8246/0.8240 -এ অবস্থিত। ফ্ল্যাগপোলের প্রজেকশন হচ্ছে 20 পয়েন্ট। এই গঠনটি ইঙ্গিত দেয় যে
M5 এবং M15 টাইম ফ্রেমে আরও ভুল এন্ট্রি পয়েন্ট থাকতে পারে।
Open chart in a new window
বুলিশ পেন্যান্ট
was formed on 04.06 at 12:17:29 (UTC+0)
signal strength 2 of 5
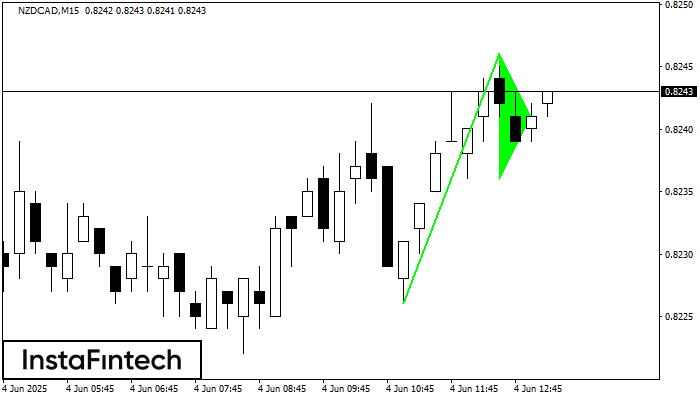
M15 চার্টে NZDCAD ইন্সট্রুমেন্টে বুলিশ পেন্যান্ট গ্রাফিক প্যাটার্ন গঠিত হয়েছে। এই প্যাটার্নের ধরনটি ধারাবাহিকতা প্যাটার্নের বিভাগে পড়ে। এই ক্ষেত্রে, যদি মূল্য সর্বোচ্চ স্তর ভেদ করতে পারে, তাহলে 0.8268 -এর স্তরে
M5 এবং M15 টাইম ফ্রেমে আরও ভুল এন্ট্রি পয়েন্ট থাকতে পারে।
Open chart in a new window
বুলিশ ফ্ল্যাগ
was formed on 04.06 at 12:12:46 (UTC+0)
signal strength 2 of 5
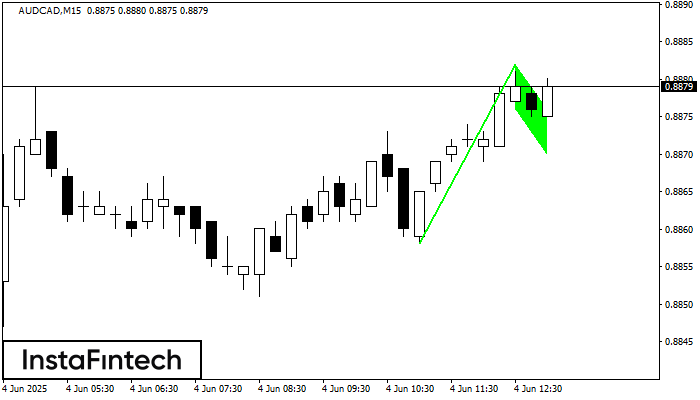
M15 চার্টে AUDCAD-এর বুলিশ ফ্ল্যাগ প্যাটার্ন গঠিত হয়েছে। প্যাটার্নের নীচের সীমানা 0.8876/0.8870 -এ অবস্থিত, এবং উপরের সীমানা 0.8882/0.8876 -এ অবস্থিত। ফ্ল্যাগপোলের প্রজেকশন হচ্ছে 24 পয়েন্ট। এই গঠনটি ইঙ্গিত দেয় যে
M5 এবং M15 টাইম ফ্রেমে আরও ভুল এন্ট্রি পয়েন্ট থাকতে পারে।
Open chart in a new window


