

অ্যাকচুয়াল প্যাটার্নস

প্যাটার্ন হলো গ্রাফিক্যাল মডেল, যা মূল্য ওঠানামার ভিত্তিতে চার্টে তৈরি হয়। টেকনিক্যাল বিশ্লেষণের নীতি অনুযায়ী, ইতিহাসের (প্রাইস মুভমেন্ট) পুনরাবৃত্তি ঘটে। অর্থাৎ, পরিস্থিতি যদি একই রকম থাকে তাহলে প্রাইস মুভমেন্টও প্রায় একই রকম হয়। এর ফলে মূল্যের ওঠানামা কেমন হবে তা আগেই থেকেই অনুমান করা যায়।
ইন্সটাফরেক্স এর প্রাসঙ্গিক প্যাটার্নসমূহ সহজেই ব্যবহার করা যায়, যার মাধ্যমে মার্কেটের সর্বশেষ পরিস্থিতি জানা যায় এবং তার উপর ভিত্তি করে সিদ্ধান্ত নেওয়া যায়। আমাদের সেবাগুলো থেকে আপনি যেকোনো পেয়ার এবং টাইমফ্রেমের জন্য সর্বশেষ এবং সবচেয়ে প্রাসঙ্গিক প্যাটার্নগুলো খুঁজে পাবেন।
Triple Top
was formed on 08.04 at 08:30:23 (UTC+0)
signal strength 3 of 5
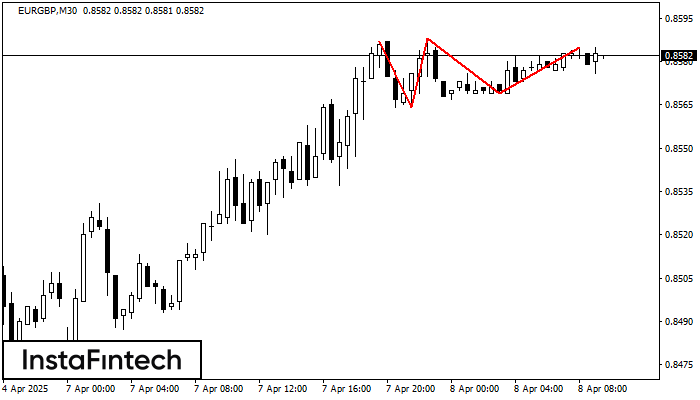
The Triple Top pattern has formed on the chart of the EURGBP M30 trading instrument. It is a reversal pattern featuring the following characteristics: resistance level 2, support level -5, and pattern’s width 23. Forecast If the price breaks through the support level 0.8564, it is likely to move further down to 0.8558.
আরও দেখুন
- All
- All
- Bearish Rectangle
- Bearish Symmetrical Triangle
- Bearish Symmetrical Triangle
- Bullish Rectangle
- Double Top
- Double Top
- Triple Bottom
- Triple Bottom
- Triple Top
- Triple Top
- All
- All
- Buy
- Sale
- All
- 1
- 2
- 3
- 4
- 5
Double Bottom
was formed on 02.06 at 11:10:02 (UTC+0)
signal strength 1 of 5
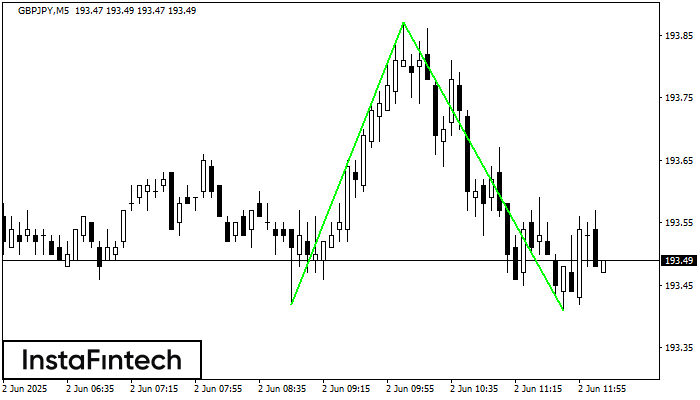
The Double Bottom pattern has been formed on GBPJPY M5. Characteristics: the support level 193.42; the resistance level 193.87; the width of the pattern 45 points. If the resistance level
The M5 and M15 time frames may have more false entry points.
Open chart in a new window
Bearish pennant
was formed on 02.06 at 09:40:38 (UTC+0)
signal strength 1 of 5
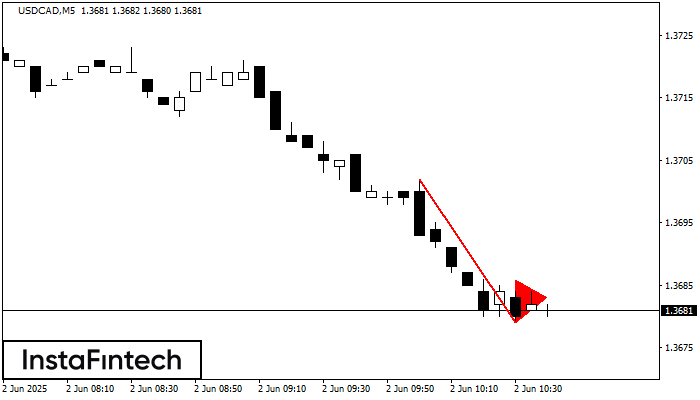
The Bearish pennant pattern has formed on the USDCAD M5 chart. It signals potential continuation of the existing trend. Specifications: the pattern’s bottom has the coordinate of 1.3679; the projection
The M5 and M15 time frames may have more false entry points.
Open chart in a new window
Bullish Symmetrical Triangle
was formed on 02.06 at 09:22:12 (UTC+0)
signal strength 4 of 5

According to the chart of H1, EURJPY formed the Bullish Symmetrical Triangle pattern. The lower border of the pattern touches the coordinates 162.28/163.37 whereas the upper border goes across 164.23/163.37
Open chart in a new window


