

অ্যাকচুয়াল প্যাটার্নস

প্যাটার্ন হলো গ্রাফিক্যাল মডেল, যা মূল্য ওঠানামার ভিত্তিতে চার্টে তৈরি হয়। টেকনিক্যাল বিশ্লেষণের নীতি অনুযায়ী, ইতিহাসের (প্রাইস মুভমেন্ট) পুনরাবৃত্তি ঘটে। অর্থাৎ, পরিস্থিতি যদি একই রকম থাকে তাহলে প্রাইস মুভমেন্টও প্রায় একই রকম হয়। এর ফলে মূল্যের ওঠানামা কেমন হবে তা আগেই থেকেই অনুমান করা যায়।
ইন্সটাফরেক্স এর প্রাসঙ্গিক প্যাটার্নসমূহ সহজেই ব্যবহার করা যায়, যার মাধ্যমে মার্কেটের সর্বশেষ পরিস্থিতি জানা যায় এবং তার উপর ভিত্তি করে সিদ্ধান্ত নেওয়া যায়। আমাদের সেবাগুলো থেকে আপনি যেকোনো পেয়ার এবং টাইমফ্রেমের জন্য সর্বশেষ এবং সবচেয়ে প্রাসঙ্গিক প্যাটার্নগুলো খুঁজে পাবেন।
Bearish pennant
was formed on 07.04 at 01:00:16 (UTC+0)
signal strength 3 of 5

The Bearish pennant pattern has formed on the NZDUSD M30 chart. It signals potential continuation of the existing trend. Specifications: the pattern’s bottom has the coordinate of 0.5563; the projection of the flagpole height is equal to 29 pips. In case the price breaks out the pattern’s bottom of 0.5563, the downtrend is expected to continue for further level 0.5533.
- All
- All
- Bearish Rectangle
- Bearish Symmetrical Triangle
- Bearish Symmetrical Triangle
- Bullish Rectangle
- Double Top
- Double Top
- Triple Bottom
- Triple Bottom
- Triple Top
- Triple Top
- All
- All
- Buy
- Sale
- All
- 1
- 2
- 3
- 4
- 5
ট্রিপল বটম
was formed on 01.05 at 17:39:48 (UTC+0)
signal strength 1 of 5

M5 চার্টে #KO-এর ট্রিপল বটম প্যাটার্নটি গঠিত হয়েছে। এই প্যাটার্নের নিম্নলিখিত বৈশিষ্ট্য রয়েছে: রেজিস্ট্যান্স স্তর 71.64/71.57; সাপোর্ট স্তর 71.39/71.35; প্রস্থ হল 25 পয়েন্ট। 71.64-এর রেজিস্ট্যান্স স্তর ব্রেক করা ঘটলে, মূল্য
M5 এবং M15 টাইম ফ্রেমে আরও ভুল এন্ট্রি পয়েন্ট থাকতে পারে।
Open chart in a new window
ইনভার্স হেড অ্যান্ড শোল্ডার্স
was formed on 01.05 at 17:30:04 (UTC+0)
signal strength 1 of 5

M5 চার্ট অনুসারে, NZDCAD-এর ইনভার্স হেড অ্যান্ড শোল্ডার্স টেকনিক্যাল প্যাটার্ন গঠিত হচ্ছে৷ যদি 0.8179/0.8176-এর নেকলাইন ব্রেক করা হয়, তাহলে ইন্সট্রুমেন্টটি 0.8191-এর দিকে যেতে পারে।
M5 এবং M15 টাইম ফ্রেমে আরও ভুল এন্ট্রি পয়েন্ট থাকতে পারে।
Open chart in a new window
বুলিশ পেন্যান্ট
was formed on 01.05 at 16:40:46 (UTC+0)
signal strength 1 of 5
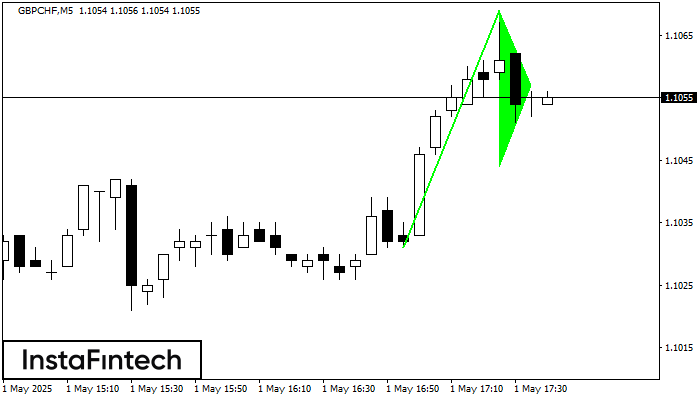
বুলিশ পেন্যান্ট সংকেত – M5 -এ GBPCHF ট্রেডিং ইন্সট্রুমেন্টের ধারাবাহিকতার প্যাটার্ন। পূর্বাভাস: প্যাটার্নের সর্বোচ্চ 1.1069 এর উপরে বাই পজিশন নির্ধারণ করা সম্ভব, পরবর্তী পদক্ষেপে ফ্ল্যাগপোলের উচ্চতার একটি প্রজেকশনের সম্ভাবনা রয়েছে।
M5 এবং M15 টাইম ফ্রেমে আরও ভুল এন্ট্রি পয়েন্ট থাকতে পারে।
Open chart in a new window


