

অ্যাকচুয়াল প্যাটার্নস

প্যাটার্ন হলো গ্রাফিক্যাল মডেল, যা মূল্য ওঠানামার ভিত্তিতে চার্টে তৈরি হয়। টেকনিক্যাল বিশ্লেষণের নীতি অনুযায়ী, ইতিহাসের (প্রাইস মুভমেন্ট) পুনরাবৃত্তি ঘটে। অর্থাৎ, পরিস্থিতি যদি একই রকম থাকে তাহলে প্রাইস মুভমেন্টও প্রায় একই রকম হয়। এর ফলে মূল্যের ওঠানামা কেমন হবে তা আগেই থেকেই অনুমান করা যায়।
ইন্সটাফরেক্স এর প্রাসঙ্গিক প্যাটার্নসমূহ সহজেই ব্যবহার করা যায়, যার মাধ্যমে মার্কেটের সর্বশেষ পরিস্থিতি জানা যায় এবং তার উপর ভিত্তি করে সিদ্ধান্ত নেওয়া যায়। আমাদের সেবাগুলো থেকে আপনি যেকোনো পেয়ার এবং টাইমফ্রেমের জন্য সর্বশেষ এবং সবচেয়ে প্রাসঙ্গিক প্যাটার্নগুলো খুঁজে পাবেন।
Bullish Flag
was formed on 10.03 at 13:49:20 (UTC+0)
signal strength 3 of 5
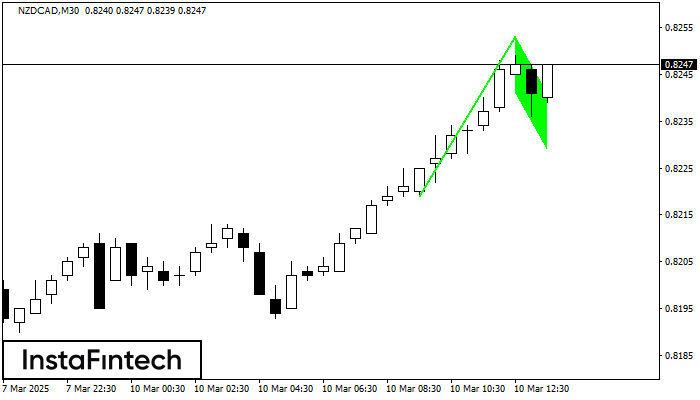
The Bullish Flag pattern has been formed on the chart NZDCAD M30 which signals that the upward trend will continue. Signals: а break of the peak at 0.8253 may push the price higher, and the rise will be the projection of the pole.
আরও দেখুন
- All
- All
- Bearish Rectangle
- Bearish Symmetrical Triangle
- Bearish Symmetrical Triangle
- Bullish Rectangle
- Double Top
- Double Top
- Triple Bottom
- Triple Bottom
- Triple Top
- Triple Top
- All
- All
- Buy
- Sale
- All
- 1
- 2
- 3
- 4
- 5
Bullish Rectangle
was formed on 30.04 at 21:12:49 (UTC+0)
signal strength 4 of 5

According to the chart of H1, #TSLA formed the Bullish Rectangle. This type of a pattern indicates a trend continuation. It consists of two levels: resistance 294.59 and support 270.55
Open chart in a new window
Bullish Rectangle
was formed on 30.04 at 21:12:27 (UTC+0)
signal strength 4 of 5
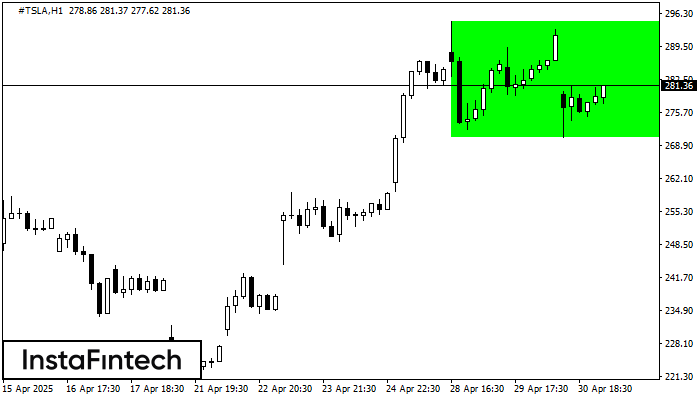
According to the chart of H1, #TSLA formed the Bullish Rectangle. The pattern indicates a trend continuation. The upper border is 294.59, the lower border is 270.55. The signal means
Open chart in a new window
Bullish Rectangle
was formed on 30.04 at 21:12:19 (UTC+0)
signal strength 3 of 5
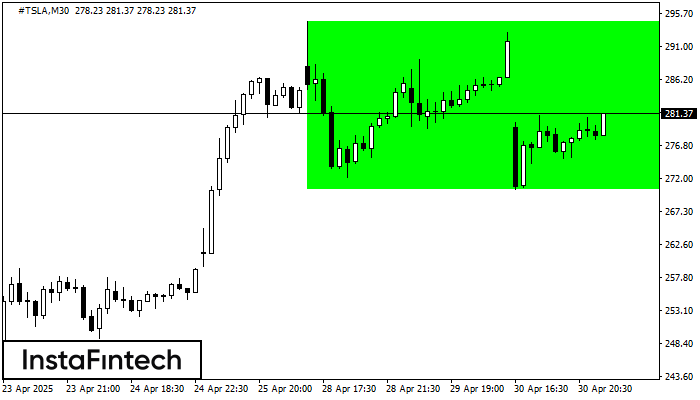
According to the chart of M30, #TSLA formed the Bullish Rectangle. This type of a pattern indicates a trend continuation. It consists of two levels: resistance 294.59 and support 270.55
Open chart in a new window


