আরও দেখুন


GOLD
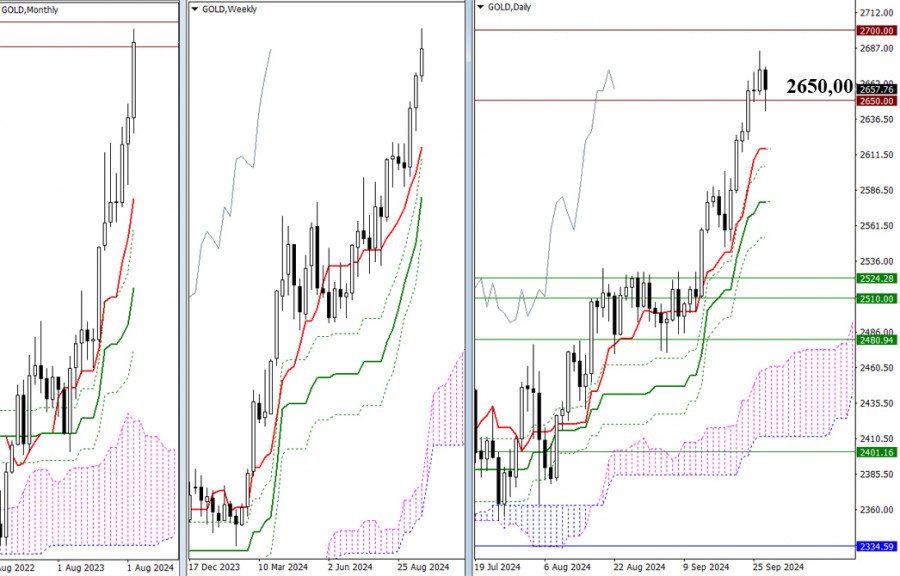
Before the end of the workweek, the bulls paused and handed over the initiative to their opponent. As a result, the main question now is whether the market will be able to test the peak (2685.09) on Monday, creating the preconditions for the continuation of the trend, or if gold will extend the upper shadow of the September monthly candle, creating opportunities for further strengthening of the bearish correction in October. In the first scenario, we will see new highs never reached, with potential psychological levels being 2700.00 – 2750.00 – 2800.00, and so on. In the event of a downward correction, the market will first encounter the support levels of the daily Ichimoku golden cross, which can currently be noted at 2615.71 – 2603.46 – 2578.24 – 2553.02.
H4 – H1
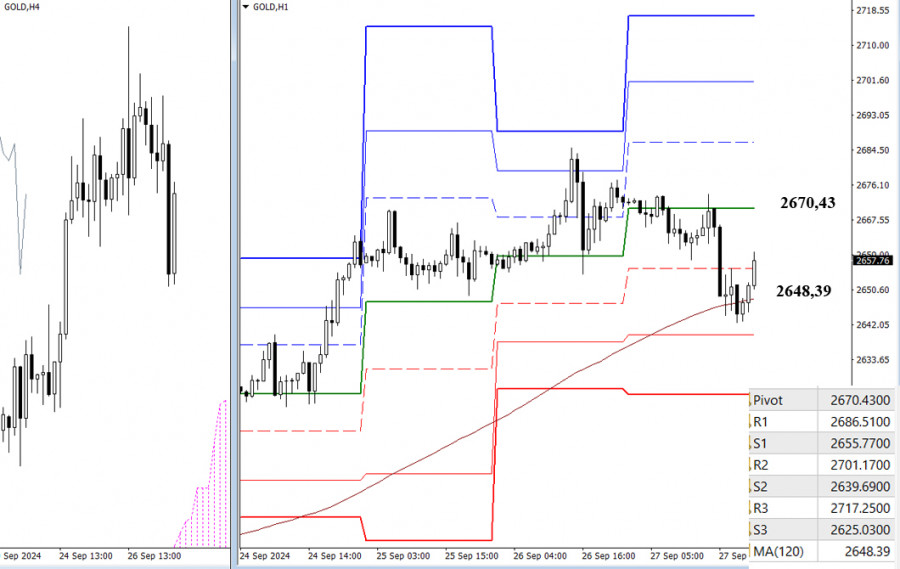
The slowdown and the beginning of the corrective decline on the higher time frames led the market, on the lower time frames, to descend to the weekly long-term trend (2648.39) and start testing it. A breakout, trend reversal, and sustained decline will indicate not just the development of a correction but the emergence of a new trend movement. The supports of the classic pivot levels provide additional intraday targets for the bears. If the weekly trend stops the decline and allows the bulls to use their strength to restore positions, further attention will be directed to the resistance of the classic pivot levels. New pivot-level values will appear when the market opens.
***
In the technical analysis, the following are used:
You have already liked this post today
*এখানে পোস্ট করা মার্কেট বিশ্লেষণ আপনার সচেতনতা বৃদ্ধির জন্য প্রদান করা হয়, ট্রেড করার নির্দেশনা প্রদানের জন্য প্রদান করা হয় না।


