

النماذج الفعلية

النماذج هي نماذج رسومية تتشكل في الرسم البياني حسب السعر. وفقا لأحد المسلمات التحليلية الفنية، فإن التاريخ (حركة السعر) يكرر نفسه. ويعني ذلك أن حركات الأسعار غالباً ما تكون متشابهة في نفس الأوضاع مما يجعل من الممكن التنبؤ بزيادة تطوير الوضع الذي يتسم باحتمال كبير.
النماذج ذات الصلة المقدمة من قبل إنستافوركس هي خدمة سهلة الاستخدام تسمح لك بمعرفة التغييرات الأخيرة في السوق والرد على الأدلة من السوق في الوقت المناسب. في خدمتنا، ستجد دائمًا النماذج الأكثر حداثة وملاءمة في أي زوج وأي إطار زمني.
Triple Bottom
was formed on 18.04 at 20:00:39 (UTC+0)
signal strength 2 of 5

The Triple Bottom pattern has formed on the chart of AUDCAD M15. Features of the pattern: The lower line of the pattern has coordinates 0.8845 with the upper limit 0.8845/0.8836, the projection of the width is 26 points. The formation of the Triple Bottom pattern most likely indicates a change in the trend from downward to upward. This means that in the event of a breakdown of the resistance level 0.8819, the price is most likely to continue the upward movement.
The M5 and M15 time frames may have more false entry points.
انظر أيضا
- All
- All
- Bearish Rectangle
- Bearish Symmetrical Triangle
- Bearish Symmetrical Triangle
- Bullish Rectangle
- Double Top
- Double Top
- Triple Bottom
- Triple Bottom
- Triple Top
- Triple Top
- All
- All
- Buy
- Sale
- All
- 1
- 2
- 3
- 4
- 5
Bawah Ganda
was formed on 03.06 at 12:05:32 (UTC+0)
signal strength 1 of 5
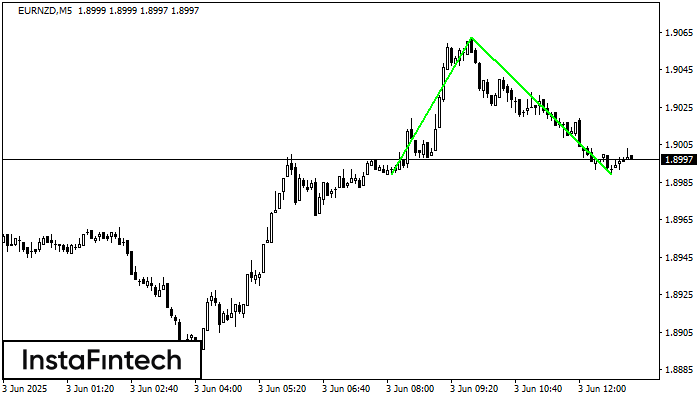
Pola Bawah Ganda telah terbentuk pada EURNZD M5; batas atas di 1.9062; batas bawah di 1.8989. Lebar pola sebesar 73 poin. Jika harga menembus batas atas 1.9062, Perubahan dalam tren
Rangka waktu M5 dan M15 mungkin memiliki lebih dari titik entri yang keliru.
Open chart in a new window
Teratas Ganda
was formed on 03.06 at 12:01:19 (UTC+0)
signal strength 3 of 5
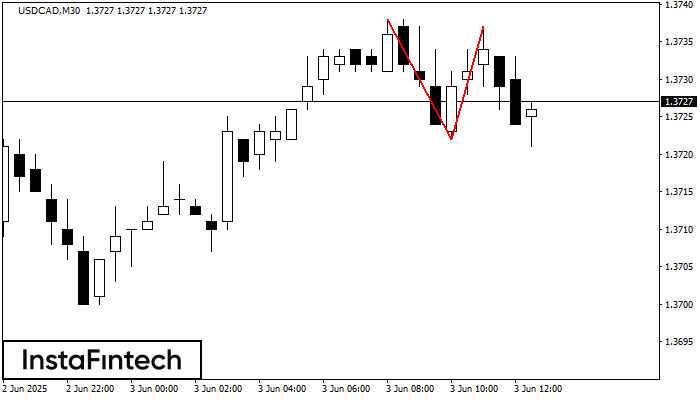
Pola Teratas Ganda telah terbentuk pada USDCAD M30. Pola ini menandakan bahwa tren telah berubah dari kenaikan menjadi penurunan. Mungkin, jika dasar pola di 1.3722 ditembus, maka pergerakan menurun akan
Open chart in a new window
Bawah Ganda
was formed on 03.06 at 11:45:31 (UTC+0)
signal strength 2 of 5
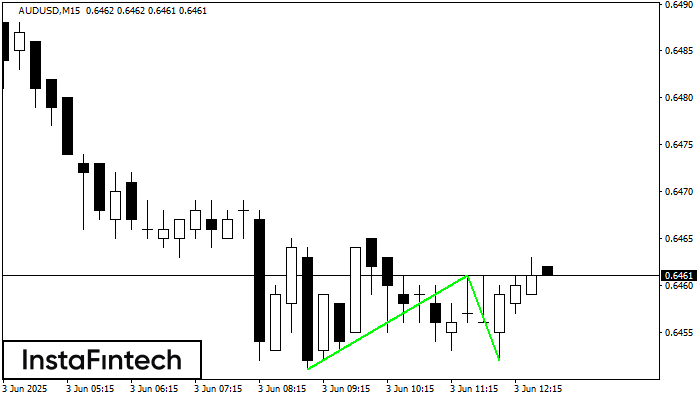
Pola Bawah Ganda telah terbentuk pada AUDUSD M15; batas atas di 0.6461; batas bawah di 0.6452. Lebar pola sebesar 10 poin. Jika harga menembus batas atas 0.6461, Perubahan dalam tren
Rangka waktu M5 dan M15 mungkin memiliki lebih dari titik entri yang keliru.
Open chart in a new window


