

النماذج الفعلية

النماذج هي نماذج رسومية تتشكل في الرسم البياني حسب السعر. وفقا لأحد المسلمات التحليلية الفنية، فإن التاريخ (حركة السعر) يكرر نفسه. ويعني ذلك أن حركات الأسعار غالباً ما تكون متشابهة في نفس الأوضاع مما يجعل من الممكن التنبؤ بزيادة تطوير الوضع الذي يتسم باحتمال كبير.
النماذج ذات الصلة المقدمة من قبل إنستافوركس هي خدمة سهلة الاستخدام تسمح لك بمعرفة التغييرات الأخيرة في السوق والرد على الأدلة من السوق في الوقت المناسب. في خدمتنا، ستجد دائمًا النماذج الأكثر حداثة وملاءمة في أي زوج وأي إطار زمني.
Triple Bottom
was formed on 31.03 at 13:00:03 (UTC+0)
signal strength 3 of 5
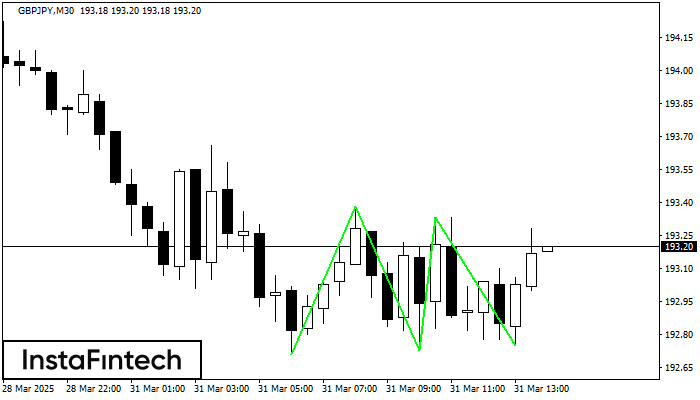
The Triple Bottom pattern has been formed on GBPJPY M30. It has the following characteristics: resistance level 193.38/193.33; support level 192.71/192.75; the width is 67 points. In the event of a breakdown of the resistance level of 193.38, the price is likely to continue an upward movement at least to 193.03.
- All
- All
- Bearish Rectangle
- Bearish Symmetrical Triangle
- Bearish Symmetrical Triangle
- Bullish Rectangle
- Double Top
- Double Top
- Triple Bottom
- Triple Bottom
- Triple Top
- Triple Top
- All
- All
- Buy
- Sale
- All
- 1
- 2
- 3
- 4
- 5
Head and Shoulders
was formed on 10.06 at 07:59:55 (UTC+0)
signal strength 3 of 5
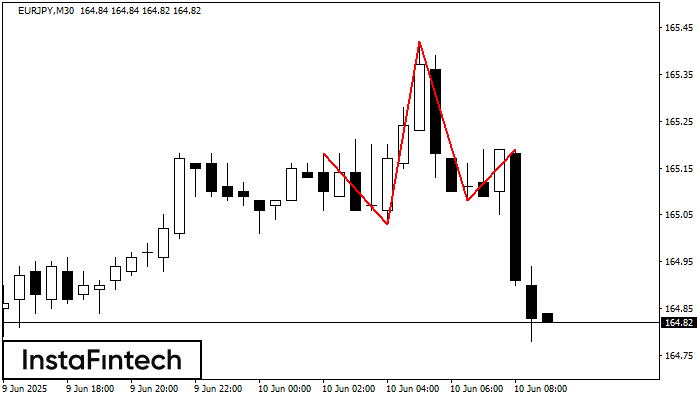
The technical pattern called Head and Shoulders has appeared on the chart of EURJPY M30. There are weighty reasons to suggest that the price will surpass the Neckline 165.03/165.08 after
Open chart in a new window
Head and Shoulders
was formed on 09.06 at 08:30:24 (UTC+0)
signal strength 3 of 5
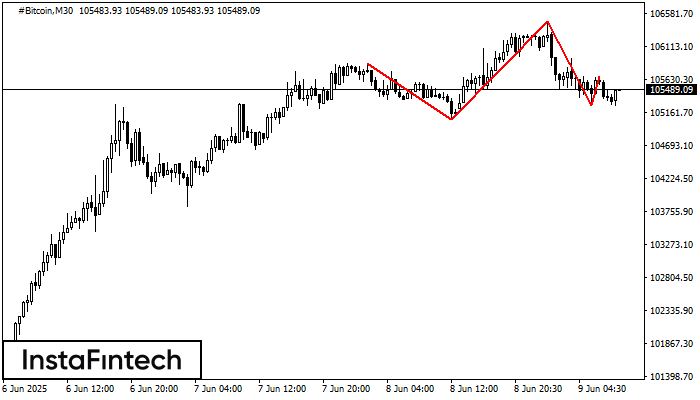
According to the chart of M30, #Bitcoin formed the Head and Shoulders pattern. The Head’s top is set at 106466.59 while the median line of the Neck is found
Open chart in a new window
Head and Shoulders
was formed on 06.06 at 14:30:02 (UTC+0)
signal strength 3 of 5
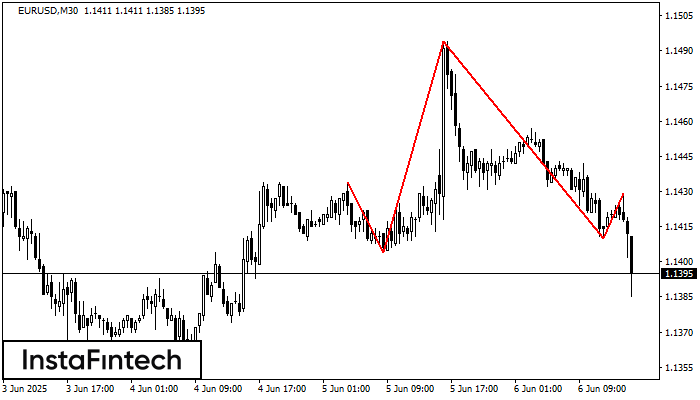
According to the chart of M30, EURUSD formed the Head and Shoulders pattern. The Head’s top is set at 1.1494 while the median line of the Neck is found
Open chart in a new window


