

النماذج الفعلية

النماذج هي نماذج رسومية تتشكل في الرسم البياني حسب السعر. وفقا لأحد المسلمات التحليلية الفنية، فإن التاريخ (حركة السعر) يكرر نفسه. ويعني ذلك أن حركات الأسعار غالباً ما تكون متشابهة في نفس الأوضاع مما يجعل من الممكن التنبؤ بزيادة تطوير الوضع الذي يتسم باحتمال كبير.
النماذج ذات الصلة المقدمة من قبل إنستافوركس هي خدمة سهلة الاستخدام تسمح لك بمعرفة التغييرات الأخيرة في السوق والرد على الأدلة من السوق في الوقت المناسب. في خدمتنا، ستجد دائمًا النماذج الأكثر حداثة وملاءمة في أي زوج وأي إطار زمني.
Actual Patterns
- All
- All
- Bearish Rectangle
- Bearish Symmetrical Triangle
- Bearish Symmetrical Triangle
- Bullish Rectangle
- Double Top
- Double Top
- Triple Bottom
- Triple Bottom
- Triple Top
- Triple Top
- All
- All
- Buy
- Sale
- All
- 1
- 2
- 3
- 4
- 5
Bullish Symmetrical Triangle
was formed on 17.04 at 19:29:20 (UTC+0)
signal strength 1 of 5

According to the chart of M5, #PEP formed the Bullish Symmetrical Triangle pattern. Description: This is the pattern of a trend continuation. 142.99 and 142.53 are the coordinates
The M5 and M15 time frames may have more false entry points.
Open chart in a new window
Bullish Symmetrical Triangle
was formed on 17.04 at 19:29:11 (UTC+0)
signal strength 1 of 5
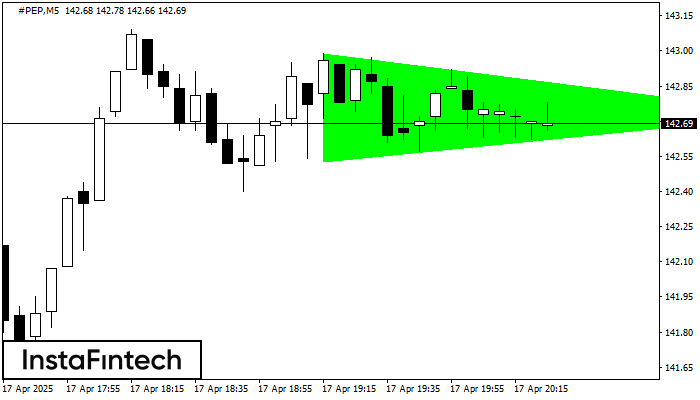
According to the chart of M5, #PEP formed the Bullish Symmetrical Triangle pattern. The lower border of the pattern touches the coordinates 142.53/142.73 whereas the upper border goes across 142.99/142.73
The M5 and M15 time frames may have more false entry points.
Open chart in a new window
Double Top
was formed on 17.04 at 19:25:16 (UTC+0)
signal strength 1 of 5
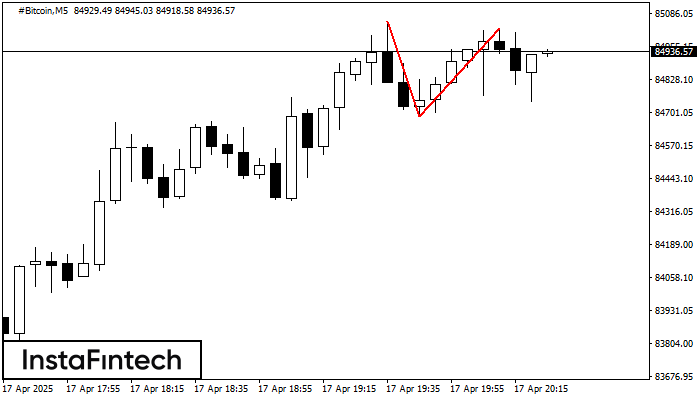
The Double Top reversal pattern has been formed on #Bitcoin M5. Characteristics: the upper boundary 85053.67; the lower boundary 84685.87; the width of the pattern is 33901 points. Sell trades
The M5 and M15 time frames may have more false entry points.
Open chart in a new window
Double Top
was formed on 17.04 at 19:20:46 (UTC+0)
signal strength 1 of 5
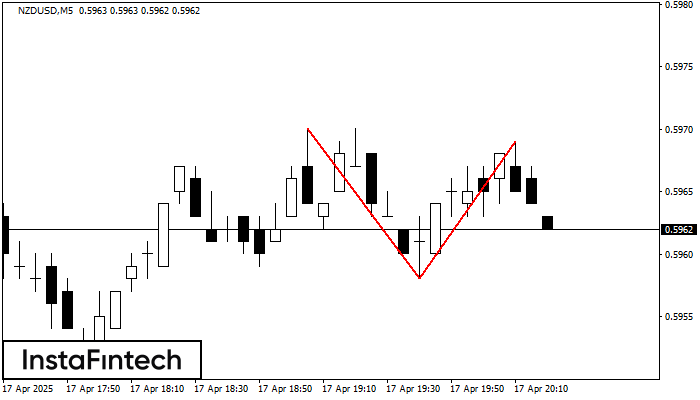
The Double Top reversal pattern has been formed on NZDUSD M5. Characteristics: the upper boundary 0.5970; the lower boundary 0.5958; the width of the pattern is 11 points. Sell trades
The M5 and M15 time frames may have more false entry points.
Open chart in a new window
Double Top
was formed on 17.04 at 19:15:19 (UTC+0)
signal strength 1 of 5
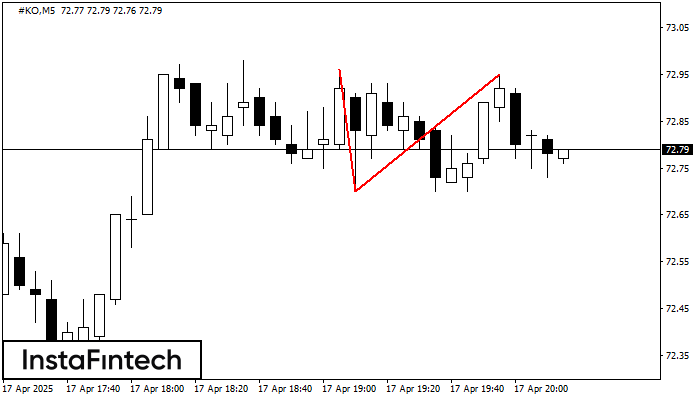
On the chart of #KO M5 the Double Top reversal pattern has been formed. Characteristics: the upper boundary 72.95; the lower boundary 72.70; the width of the pattern 25 points
The M5 and M15 time frames may have more false entry points.
Open chart in a new window
Head and Shoulders
was formed on 17.04 at 18:45:16 (UTC+0)
signal strength 2 of 5
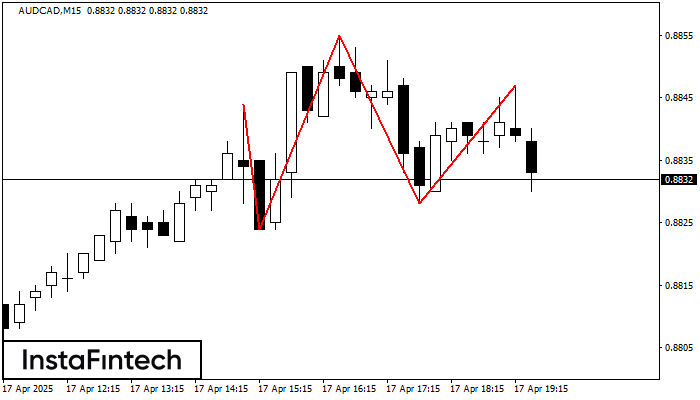
The AUDCAD M15 formed the Head and Shoulders pattern with the following features: The Head’s top is at 0.8855, the Neckline and the upward angle are at 0.8824/0.8828. The formation
The M5 and M15 time frames may have more false entry points.
Open chart in a new window
Triple Top
was formed on 17.04 at 18:45:16 (UTC+0)
signal strength 1 of 5
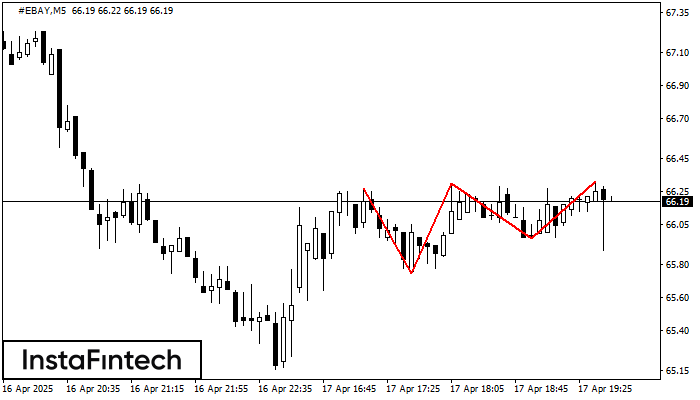
The Triple Top pattern has formed on the chart of the #EBAY M5. Features of the pattern: borders have an ascending angle; the lower line of the pattern
The M5 and M15 time frames may have more false entry points.
Open chart in a new window
Double Bottom
was formed on 17.04 at 18:45:14 (UTC+0)
signal strength 2 of 5
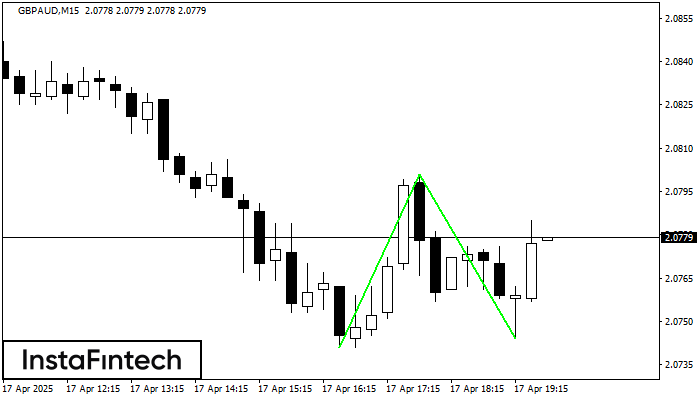
The Double Bottom pattern has been formed on GBPAUD M15; the upper boundary is 2.0801; the lower boundary is 2.0744. The width of the pattern is 60 points. In case
The M5 and M15 time frames may have more false entry points.
Open chart in a new window
Bearish Flag
was formed on 17.04 at 18:36:16 (UTC+0)
signal strength 5 of 5
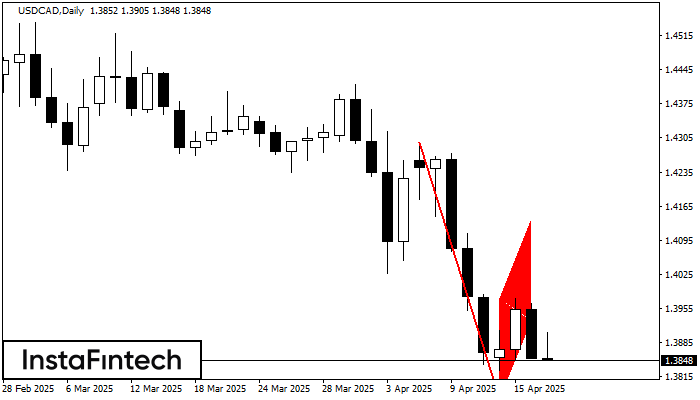
The Bearish Flag pattern has been formed on the chart USDCAD D1 which signals that the downward trend will continue. If the price breaks below the low at 1.3767, then
Open chart in a new window


