
 11.07.2022 02:47 PM
Hello, dear traders!
Let's start today's review of the GBP/USD pair with the fact that the UK is expected to have serious problems in the coming winter period. The point is that energy prices are so high that the traditionally prosperous British will face tough times. While British Prime Minister Boris Johnson continues to dance to the tune of the United States, Great Britain risks being left without the necessary heating. In other words, Britain is braced for a cold winter, during which its citizens will have to hide under duvets and rugs. All this stems from the government's extremely aggressive policy regarding sanctions against Russia. Now let's consider the situation from a technical point of view, starting with the analysis of the previous trading week.
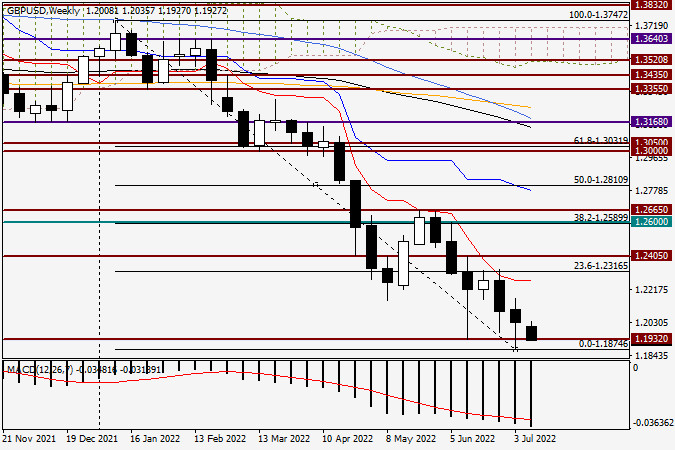
Weekly chart
Last week, pound bulls managed to turn the tide in their favor. This can be confirmed by the last weekly candlestick with a long lower shadow and a bullish body. After the formation of such candlesticks, the quote usually rises. However, this is not the case. The pound sterling is still trading under strong selling pressure against the US dollar. It is quite difficult to guess what will happen next. However, I still believe that the most likely scenario in the short term is bullish. If the pound sterling breaks through the support level of 1.1874, this scenario will be canceled. In the meantime, I expect the GBP/USD pair to form reversal candlestick signals at the bottom of the market. In this case, it will be possible to open long positions on the British pound. That's all for today. Tomorrow we will consider the pair's dynamics from a technical point of view on smaller time frames.
Have a good day!
You have already liked this post today
*The market analysis posted here is meant to increase your awareness, but not to give instructions to make a trade.
من المحتمل أن يتداول سعر المعدن الأصفر بين 3,203 وقد يصل إلى قاع القناة الهابطة حول 3,181 في الأيام القادمة، وهو مستوى يتزامن مع المتوسط المتحرك الأسي 200 عند 3,173
في وقت مبكر من الجلسة الأمريكية، يتداول زوج اليورو/الدولار الأمريكي حول 1.1378 داخل قناة الاتجاه الهابط التي تشكلت في 17 أبريل، ويظهر علامات على استنفاد القوة الصعودية. من المحتمل حدوث
روابط مفيدة: مقالاتي الأخرى متوفرة في هذا القسم دورة InstaForex للمبتدئين التحليلات الشائعة افتح حساب تداول مهم: يجب على المبتدئين في تداول الفوركس أن يكونوا حذرين للغاية عند اتخاذ قرارات
روابط مفيدة: مقالاتي الأخرى متوفرة في هذا القسم دورة InstaForex للمبتدئين التحليلات الشائعة افتح حساب تداول مهم: يجب على المبتدئين في تداول الفوركس أن يكونوا حذرين للغاية عند اتخاذ القرارات
مع ظهور نماذج الوتد المتسع المتباين والهابط على الرسم البياني لمدة 4 ساعات لزوج العملات المتقاطع AUD/JPY، على الرغم من أن حركة السعر تقع تحت المتوسط المتحرك الأسي (21) الذي
على الرسم البياني لمدة 4 ساعات للزوج الرئيسي USD/JPY، يمكن ملاحظة أن مؤشر Stochastic Oscillator يشكل نمط القاع المزدوج بينما يشكل حركة سعر USD/JPY قمة أعلى، مما يعطي هذا التباين
خطة التداول لدينا للساعات القادمة هي البيع تحت مستوى 1.1410 مع أهداف عند 1.1370 و1.1230. مؤشر النسر يعطي إشارة سلبية، لذلك نعتقد أن تصحيحًا تقنيًا قد يحدث على المدى القصير
فيراري إف8 تريبوتو
من إنستافوركس
نادي إنستافوركس

Your IP address shows that you are currently located in the USA. If you are a resident of the United States, you are prohibited from using the services of InstaFintech Group including online trading, online transfers, deposit/withdrawal of funds, etc.
If you think you are seeing this message by mistake and your location is not the US, kindly proceed to the website. Otherwise, you must leave the website in order to comply with government restrictions.
Why does your IP address show your location as the USA?
Please confirm whether you are a US resident or not by clicking the relevant button below. If you choose the wrong option, being a US resident, you will not be able to open an account with InstaTrade anyway.
We are sorry for any inconvenience caused by this message.

